
In a zero-sum world where the devastation among the small and regional banks means larger banks get bigger and more profitable, we doubt it will come as a surprise that Bank of America followed in JPMorgan's footsteps and reported blowout Q1 earnings this morning, beating across the board, with revenue boosted not only by soaring Net Interest Income but also by solid earnings across the bank's various trading operations.
Here are the main highlights from BofA's Q1 earnings:
- EPS 94c, Exp. 84c, up 18% or 14c from 80c y/y
- Revenue net of interest expense $26.26 billion, +13% y/y, beating estimate $25.4 billion
- Trading revenue excluding DVA $5.05 billion, +8.7% y/y, beating estimate $4.46 billion
- FICC trading revenue excluding DVA $3.43 billion, +29% y/y, beating estimate $2.62 billion
- Equities trading revenue excluding DVA $1.62 billion, -19% y/y, missing estimate $1.8 billiom
- Wealth & investment management total revenue $5.32 billion, -2.9% y/y, missing estimate $5.48 billion
- Trading revenue excluding DVA $5.05 billion, +8.7% y/y, beating estimate $4.46 billion
- Net interest income FTE $14.58 billion, +25% y/y, estimate $14.42 billion
Of note, revenue from FICC (fixed-income, currencies and commodities trading) unexpectedly rose almost 30% to $3.43 billion as clients reacted to changing interest rates, the bank said. That helped the bank top analysts’ estimates for earnings per share.
(Click on image to enlarge)

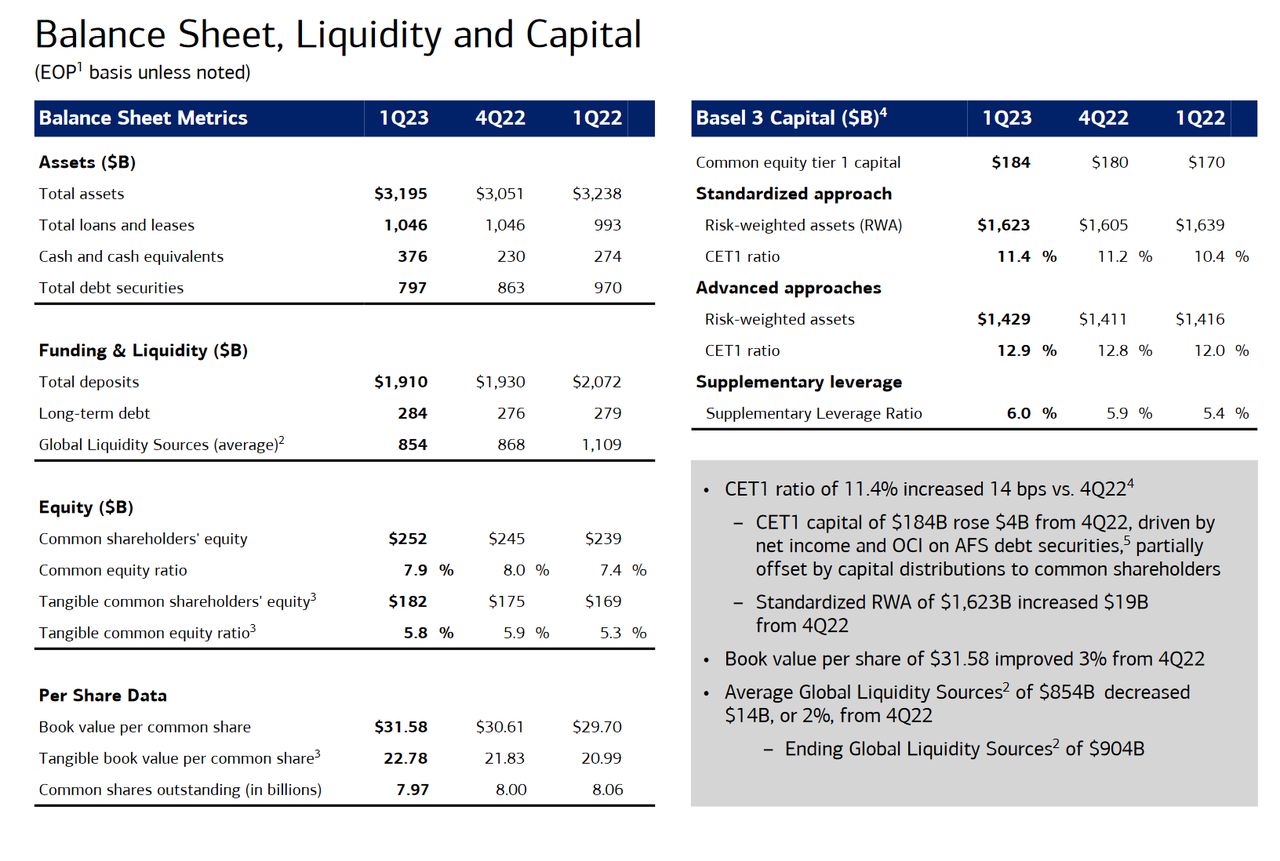
Some more balance sheet stats:
- Return on average equity 12.5%, estimate 10.9%
- Return on average assets 1.07%, estimate 0.92%
- Return on average tangible common equity 17.4% vs. 15.5% y/y, estimate 15.4%
- Basel III common equity Tier 1 ratio fully phased-in, advanced approach 12.9% vs. 12% y/y, estimate 12.6%
- Standardized CET1 ratio 11.4% vs. 10.4% y/y, estimate 11.3%
- Efficiency ratio 61.5%, estimate 63.1%
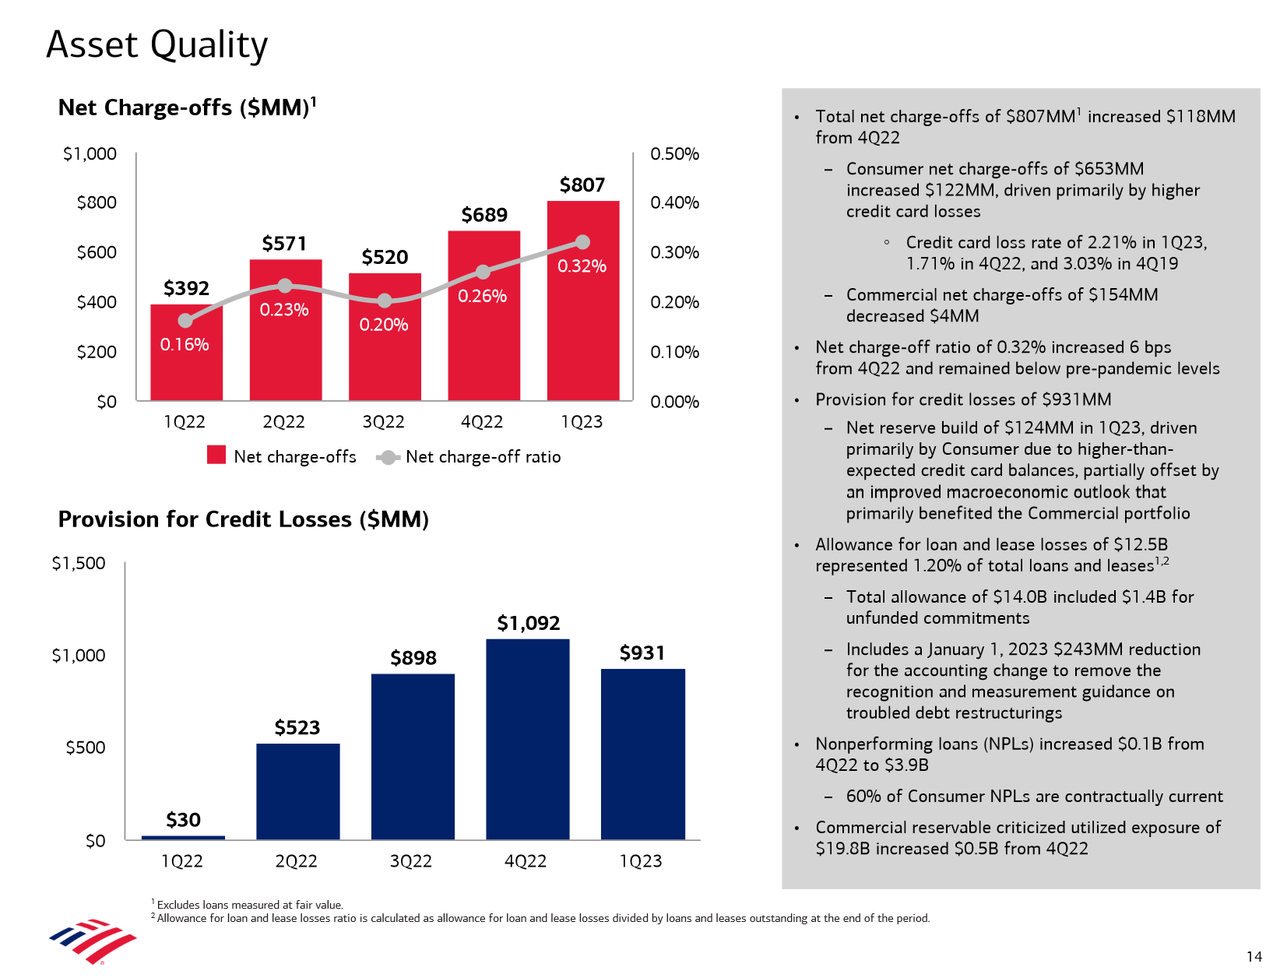
On the bad debt side, things were bad, but not as bad as consensus expected, with the bank reserving a $931 million provision for credit losses vs. $30 million y/y, but below the $1.092 billion in Q4'22 and smaller than the estimate $1.18 billion. According to BofA, the net reserve build of $124MM in 1Q23, was driven primarily by Consumer "due to higher-than-expected credit card balances, partially offset by an improved macroeconomic outlook that primarily benefited the Commercial portfolio." In total, net reserve build of $360 million, driven primarily by higher-than-expected credit card balances.
Notably, the provision for credit losses reflected a benefit of $237 million, driven primarily by an improved macroeconomic outlook, and decreased $402m from 1Q22 as the prior year was impacted by reserve builds. At the same time, provisions in the consumer unit were up a lot more than expected though. They came in at $1.089 billion, compared with the $946 million analysts were calling for.
The net charge-offs meanwhile rose to $807 million vs. $392 million y/y and $689 million q/q, modestly above the estimate $782.6 million. According to BofA, consumer net charge-offs of $653MM increased $122MM, driven primarily by higher credit card losses; overall, the credit card loss rate rose to 2.21% in 1Q23, 1.71% in 4Q22, and 3.03% in 4Q19. Curiously, commercial net charge-offs of $154MM decreased $4MM; the net charge-off ratio of 0.32% increased 6 bps from 4Q22 and remained below pre-pandemic levels.
Finally, BofA's total allowance for loan and lease losses of $12.5B represented 1.20% of total loans and leases. The total allowance of $14.0B included $1.4B for unfunded commitments, and includes a January 1, 2023 $243MM reduction for the accounting change to remove the recognition and measurement guidance on troubled debt restructurings. Also of note, nonperforming loans (NPLs) increased $0.1B from 4Q22 to $3.9B, while commercial reservable criticized utilized exposure of $19.8B increased $0.5B from 4Q22.
(Click on image to enlarge)
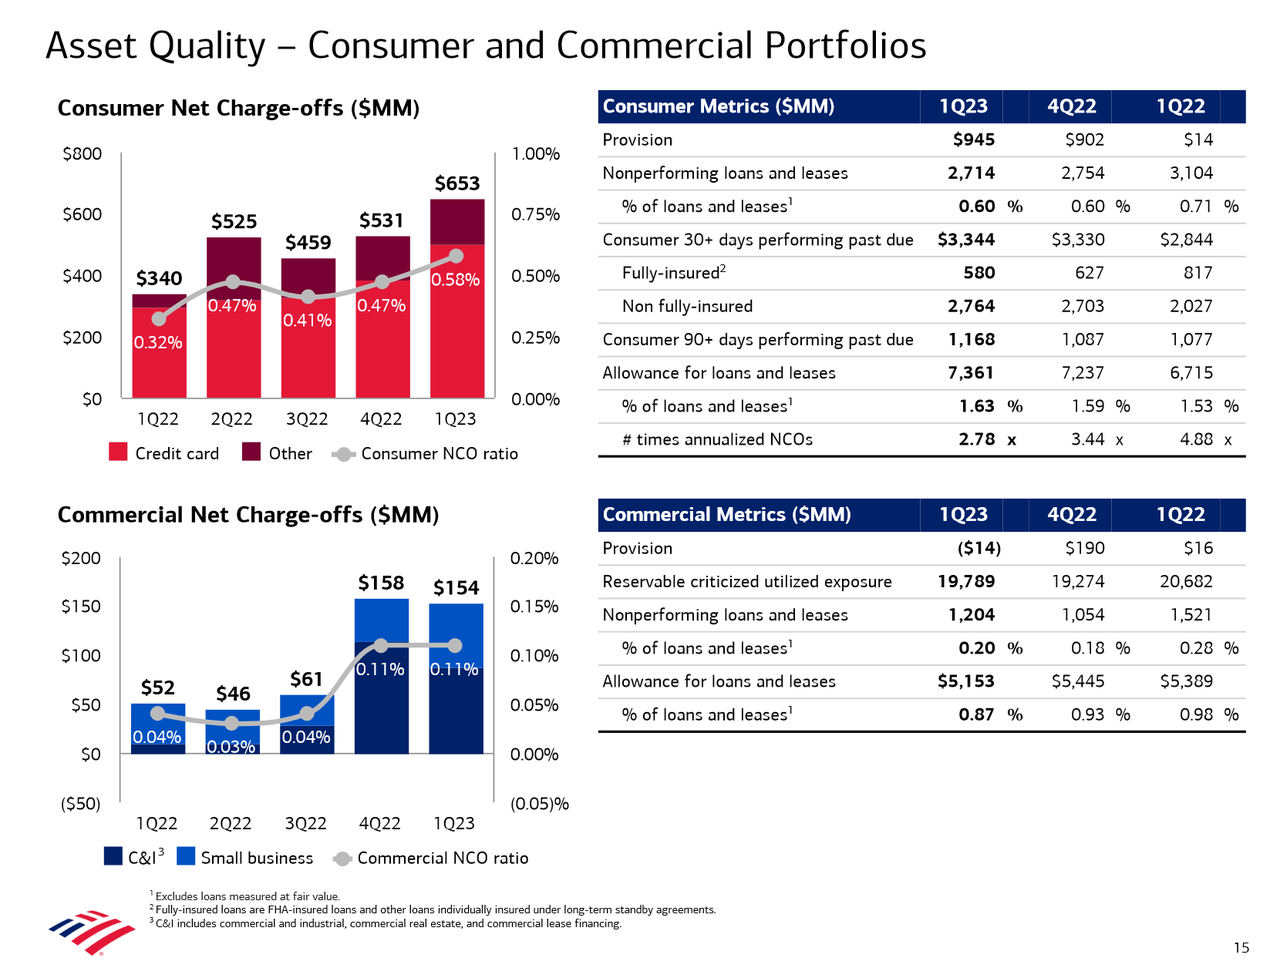
A drill down into BofA's consumer and commercial portfolios is shown below:
(Click on image to enlarge)
Turning to BofA's Net Interest Income, it rose a whopping $2.9BN or 25% Y/Y to $14.4B ($14.6B FTE), translated into a net interest yield 2.2% vs. 1.69% y/y (in line with the estimate of 2.21%) and was driven by benefits from higher interest rates and loan growth. Sequentially, NII decreased $0.2B from 4Q 22, as "the benefit from higher interest rates was more than offset by lower deposit balances, two fewer interest accrual days, and lower NII related to GM activity."
Some more details:
- NII related to GM activity declined approximately $0.9B YoY, and $0.3B from 4Q22, and was offset in noninterest income
- Premium amortization expense of $34MM in 1Q23, $210MM in 4Q22, and $905MM in 1Q22
- Net interest yield of 2.20% increased 51 bps YoY and decreased 2 bps from 4Q22
- Excluding GM, net interest yield of 2.85%;1 up 86 bps YoY
(Click on image to enlarge)
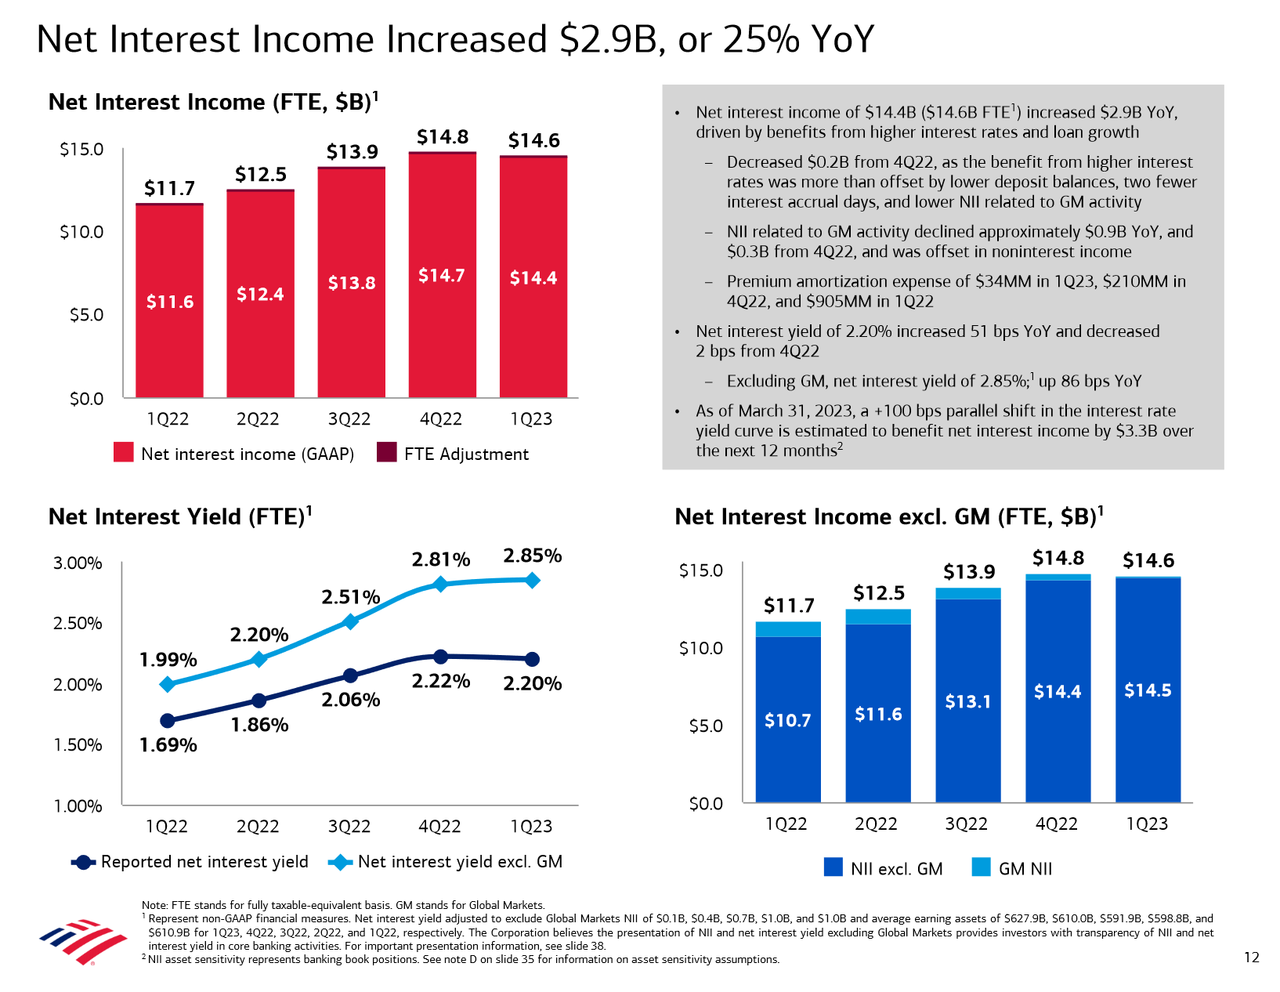
And for the yield curve purists and theoreticians, BofA updated its parallel shift calculation to note that as of March 31, 2023, a +100 bps parallel shift in the interest rate yield curve is estimated to benefit net interest income by $3.3B over the next 12 months
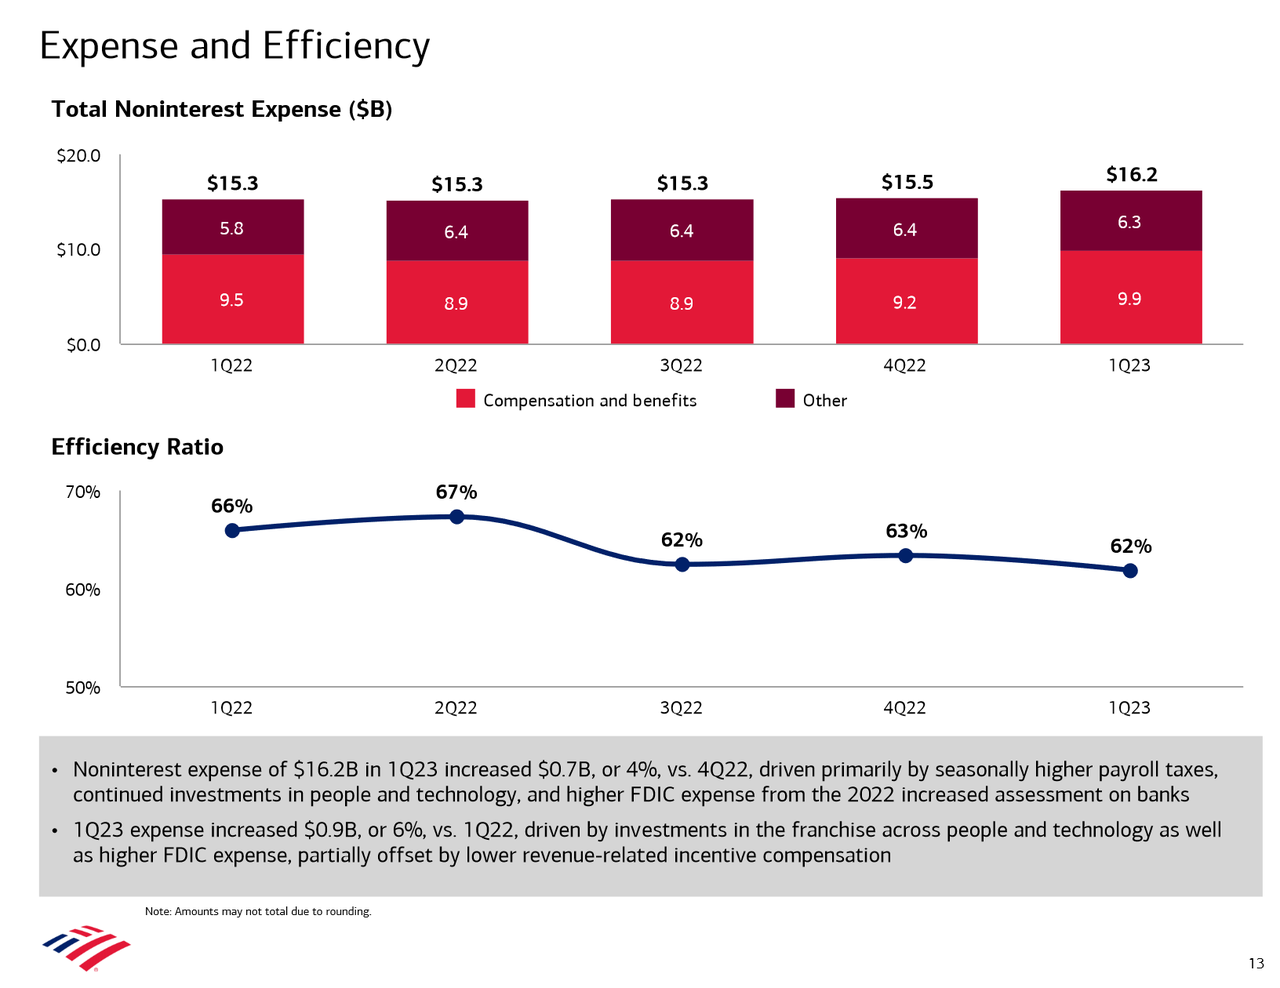
On the expenses side, BofA reported that compensation expenses rose 4.6%y/y to $9.92 billion, just above the estimate $9.82 billion. Total non-interest expenses rose 6% to $16.24 billion from $15.3 billion a year ago, higher than the estimate of $15.97 billion. Costs have been a focal point for investors, with persistent inflation putting pressure on spending and spurring wage growth.
(Click on image to enlarge)
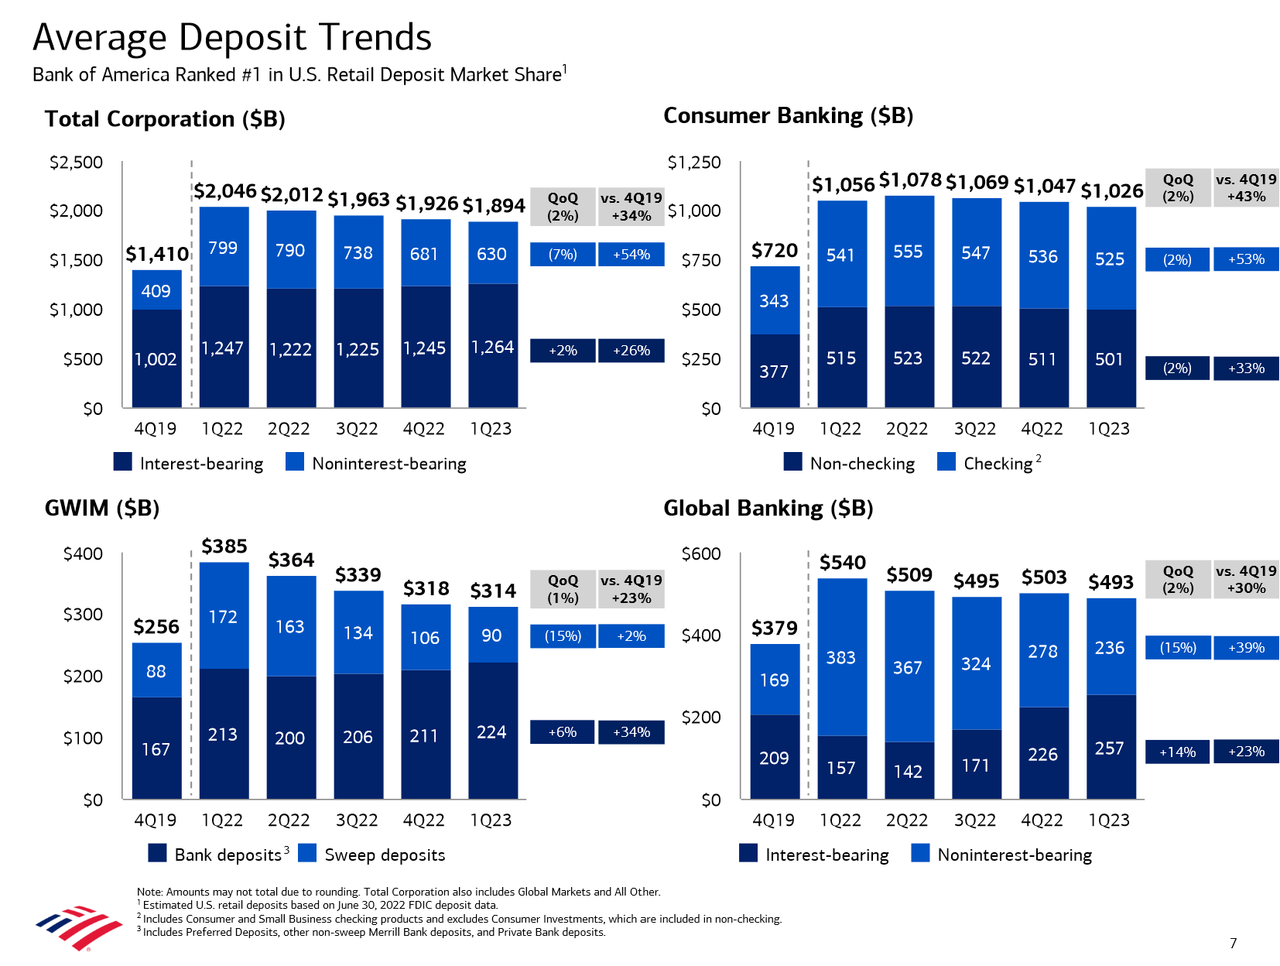
At a time when everyone is hypnotized by bank deposit and loan data, BofA spent several pages in its presentation to cover this key topic now that regional banks continue to be swept up in a slow-motion deposit run. Here are the highlights:
- Loans $1.046 trillion, estimate $1.05 trillion
- Deposits fell less than expected as customers piled into the biggest US bank after the collapse of three smaller firms. The lender had $1.91 trillion in deposits at the end of March, compared with analysts’ estimates of $1.88 trillion. That means that an influx of clients seeking safety countered outflows from inflation and customers seeking higher-yielding alternatives.
- Total deposits $1.91 trillion, estimate $1.88 trillion
- Average consumer deposits dropped by $30 billion compared to Q1 2022, about a 3% drop, but remained above $1 trillion;
- Q1 consumer average deposits $1.026 trillion vs $1.056 trillion Y/Y
- 57% of deposits were in checking accounts and 92% were primary accounts
(Click on image to enlarge)
As one would expected under QT, which has a secondary effect of shrinking commercial bank balance sheets, the bank's deposits have continued to shrink; this means that while BofA did not see a run on its deposits, unlike JPM - which saw deposits actually increase sequentially - BofA did not benefit as much from the bank run hammering its smaller competitors.
(Click on image to enlarge)
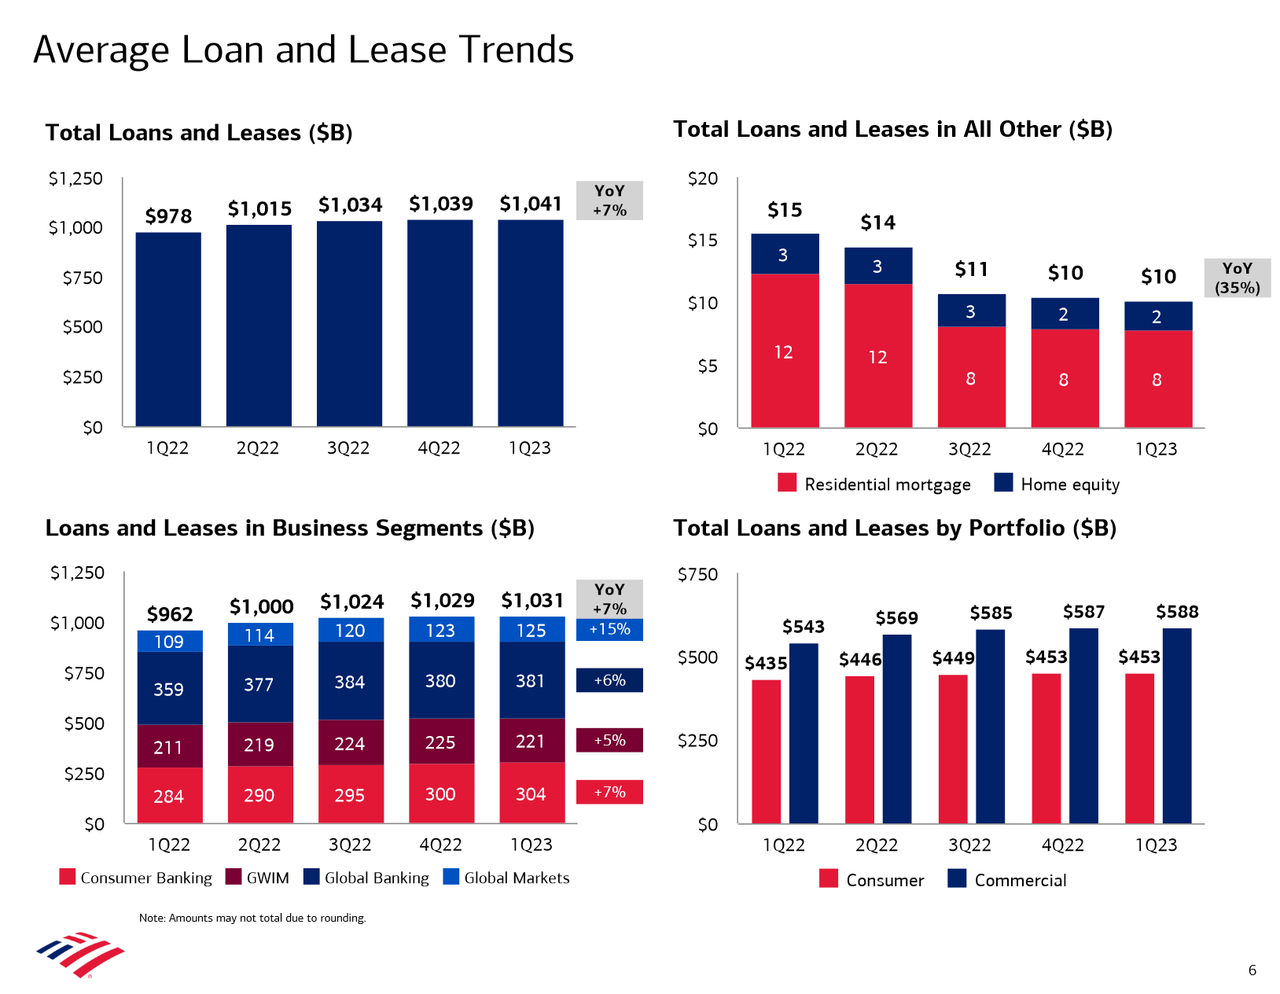
Meanwhile on the loan side, BofA's loans and leases were flat sequentially, an extension of the recent trends where bank loans are increasingly being relied upon to fill the void from shrinking Fed reserves and QT.
(Click on image to enlarge)
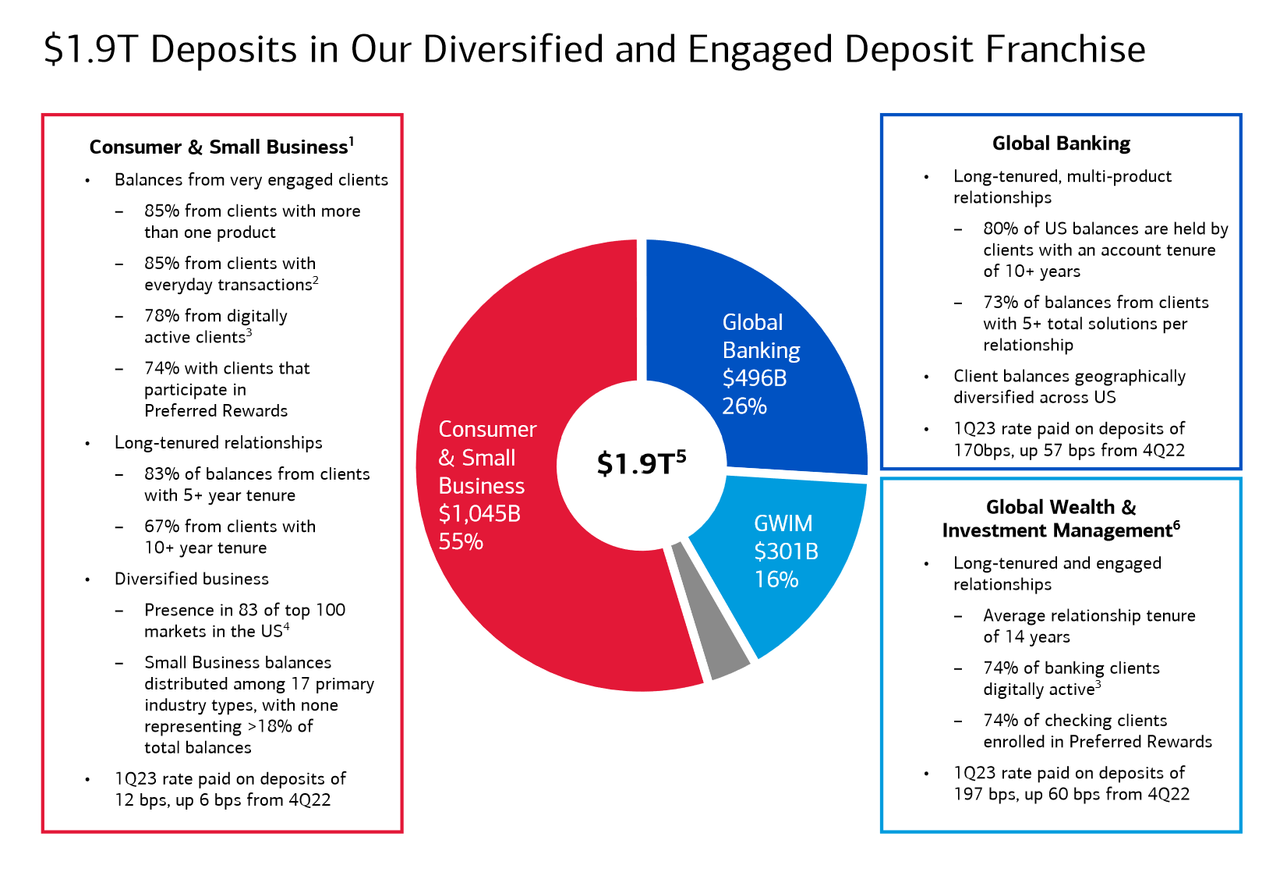
Turning back to deposits - an especially touchy topic now that so many small banks went tits up because they suddenly found themselves without these - BofA notes that it has $1.9tn in deposits across its franchise...
(Click on image to enlarge)
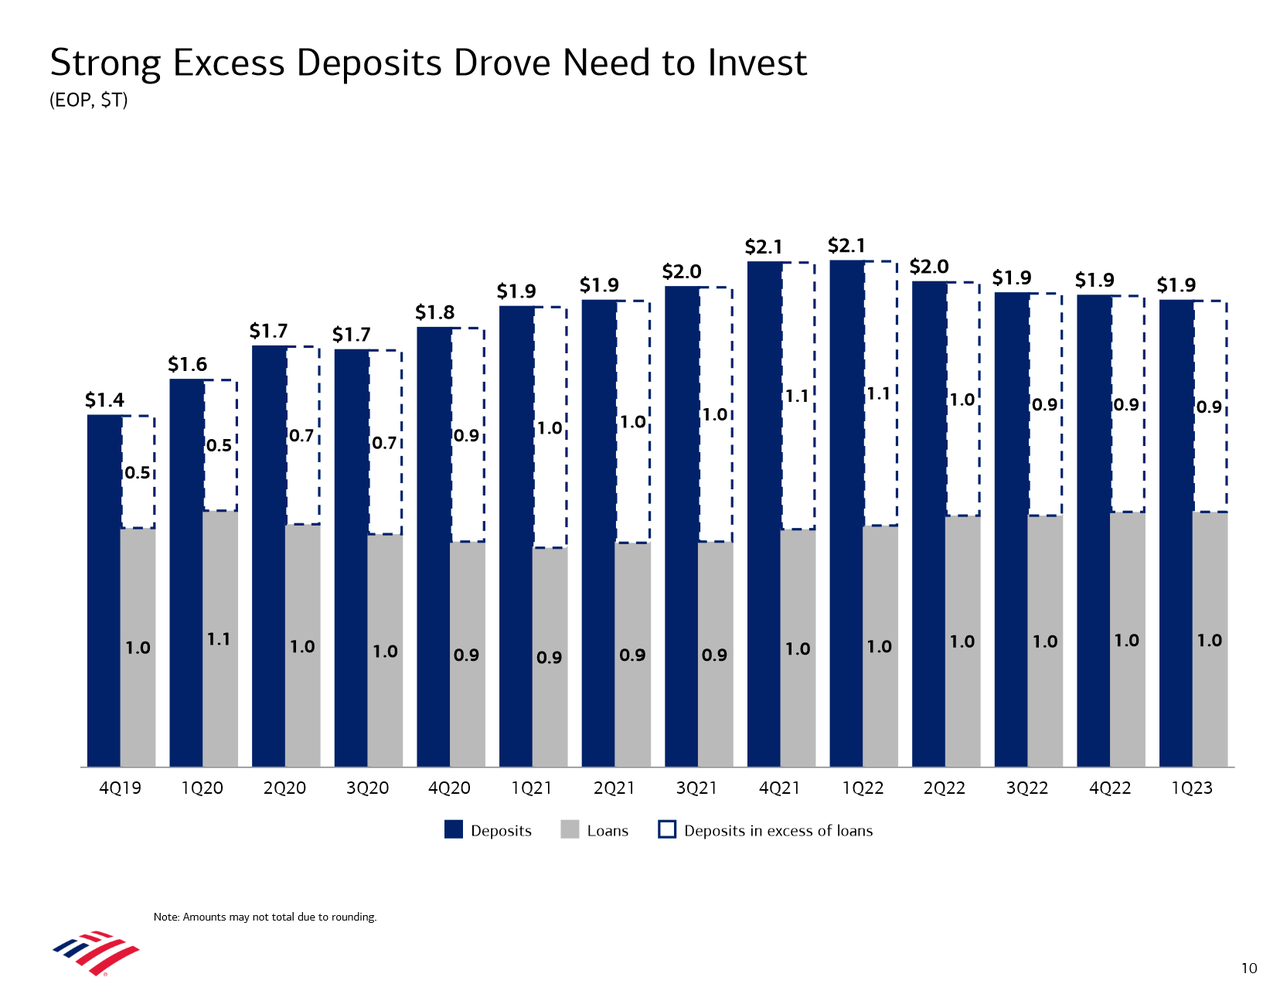
... before showing a unique slide, one which we hadn't seen since the JPM London Whale fiasco more than a decade ago, and one which confirms what QE's market moving mechanism is. In the slide below, BofA shows just how vast the total excess deposits gap became during the post-covid QE. As a reminder, excess deposits is always and only a byproduct of QE (as banks find themselves flooded with deposits, while they don't have a matching and offsetting increase in loans, instead it is the Fed that injects these). No surprise to regular readers, BofA's deposits in excess of loans grew from $0.5T in 4Q19 to $1.1T (4Q21-1Q22) and were $0.9T at March 31, 2023. Thank covid, helicopter money and the regional bank crisis for the surge.
(Click on image to enlarge)
The next chart that drills down into this, showing what "investments" BofA made to "extract the value of deposits."
(Click on image to enlarge)
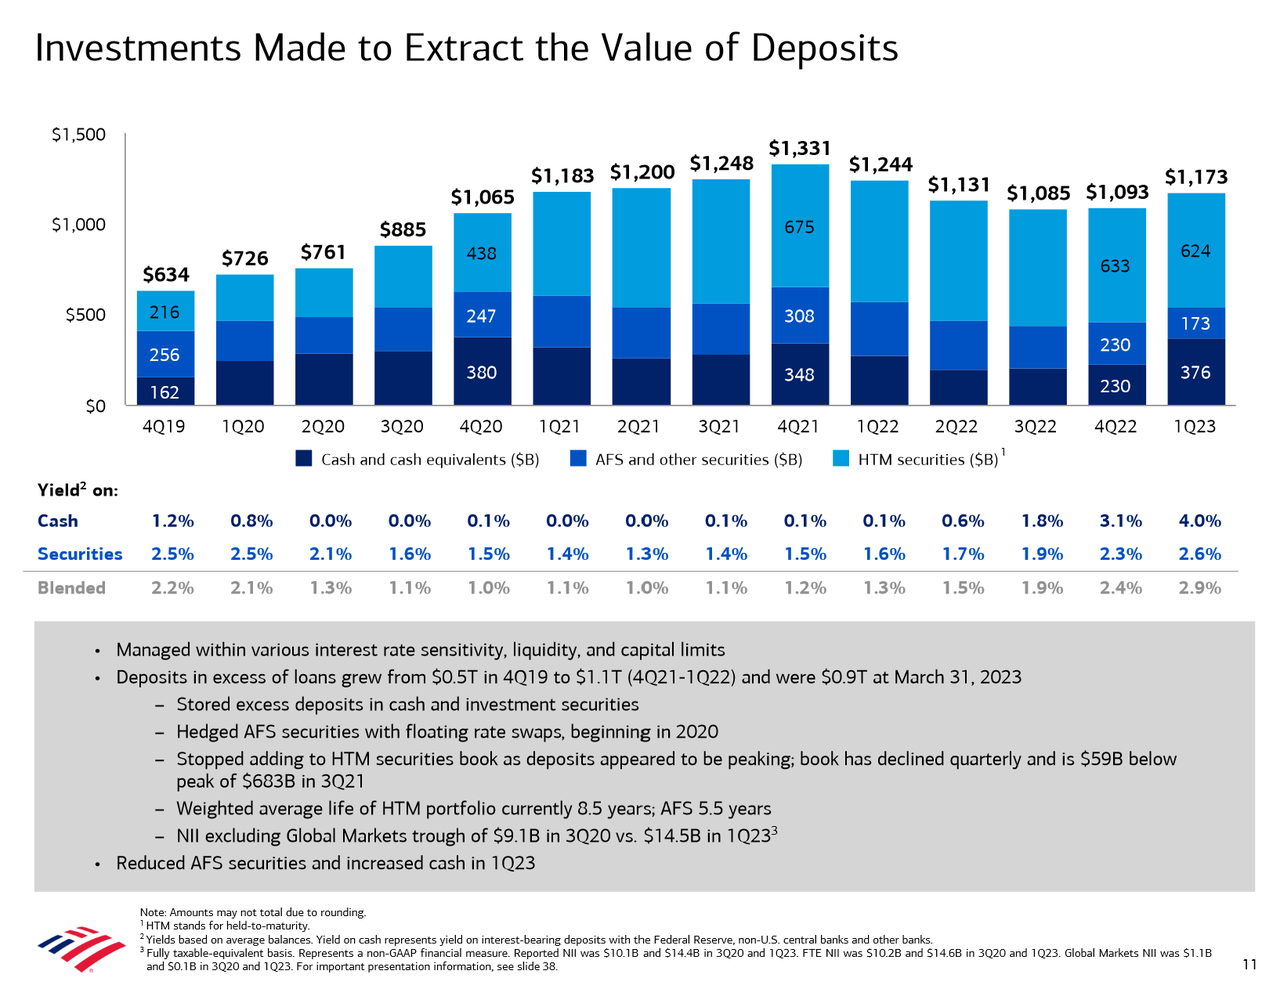
Knowing well that investors will be especially curious how it managed its excess deposits in the aftermath of the SVB disaster, the bank said that it "managed within various interest rate sensitivity, liquidity, and capital limits"; and here are the details of what BofA did:
- Stored excess deposits in cash and investment securities
- Hedged AFS securities with floating rate swaps, beginning in 2020
- Stopped adding to HTM securities book as deposits appeared to be peaking; book has declined quarterly and is $59B below peak of $683B in 3Q21
- Weighted average life of HTM portfolio currently 8.5 years; AFS 5.5 years
- NII excluding Global Markets trough of $9.1B in 3Q20 vs. $14.5B in 1Q233
- Reduced AFS securities and increased cash in 1Q2
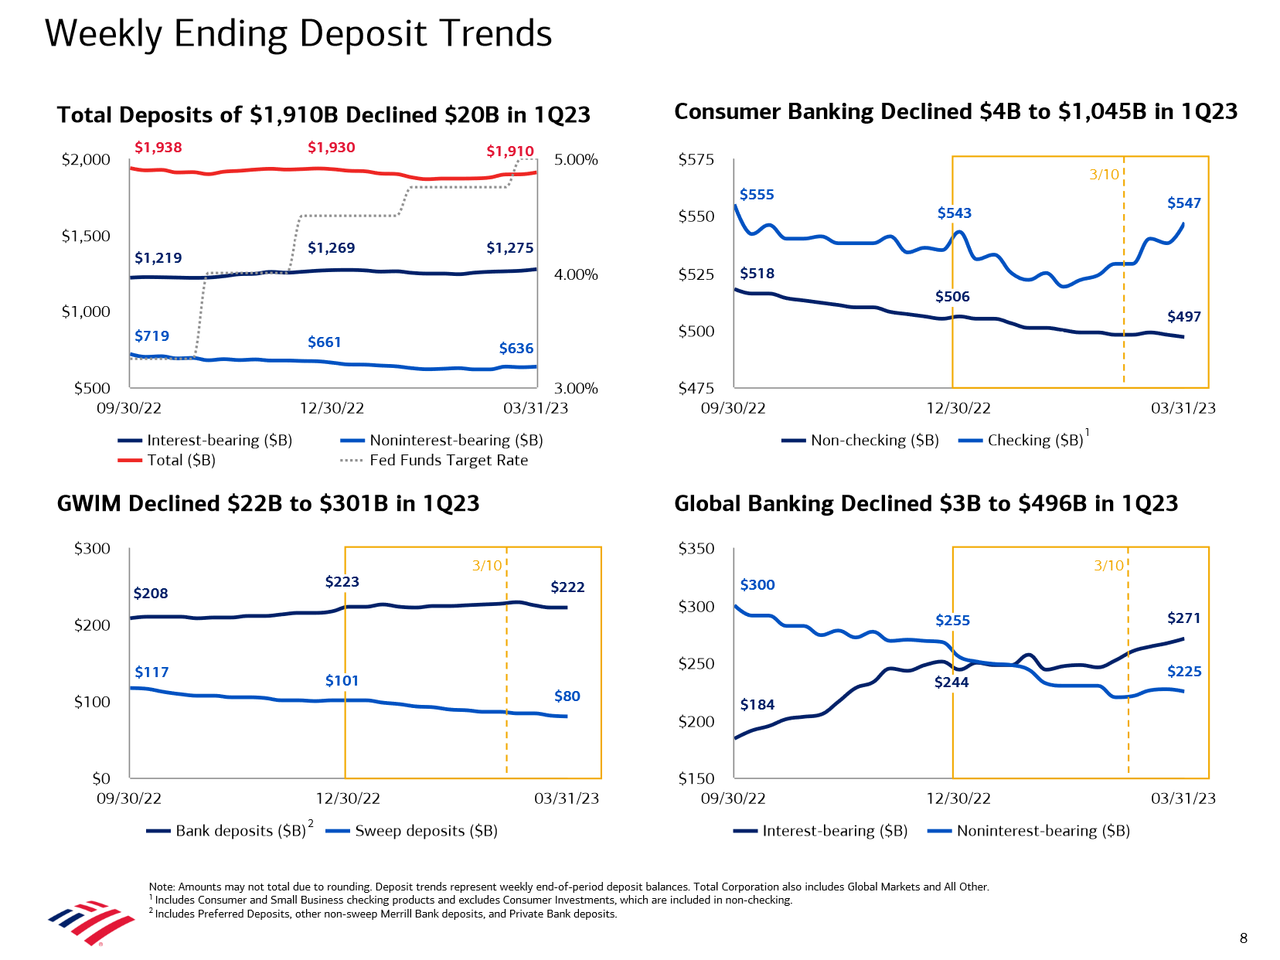
Translation: we are not SVB so please don't pull your deposits. And courtesy of the final deposit chart, showing weekly changes, it is clear that BofA's deposits aren't going anywhere.
(Click on image to enlarge)
That about covers it for BofA's loans and deposits; let's take another quick look at the bank's ibanking and markets groups, which as noted above, handily beat expectations at the FICC group but missed for equity trading:
- FICC trading revenue excluding DVA $3.43 billion, +29% y/y, beating estimate $2.62 billion
- Equities trading revenue excluding DVA $1.62 billion, -19% y/y, missing estimate $1.8 billiom
- In total, trading revenue excluding DVA $5.05 billion, +8.7% y/y, beating estimate $4.46 billion
(Click on image to enlarge)
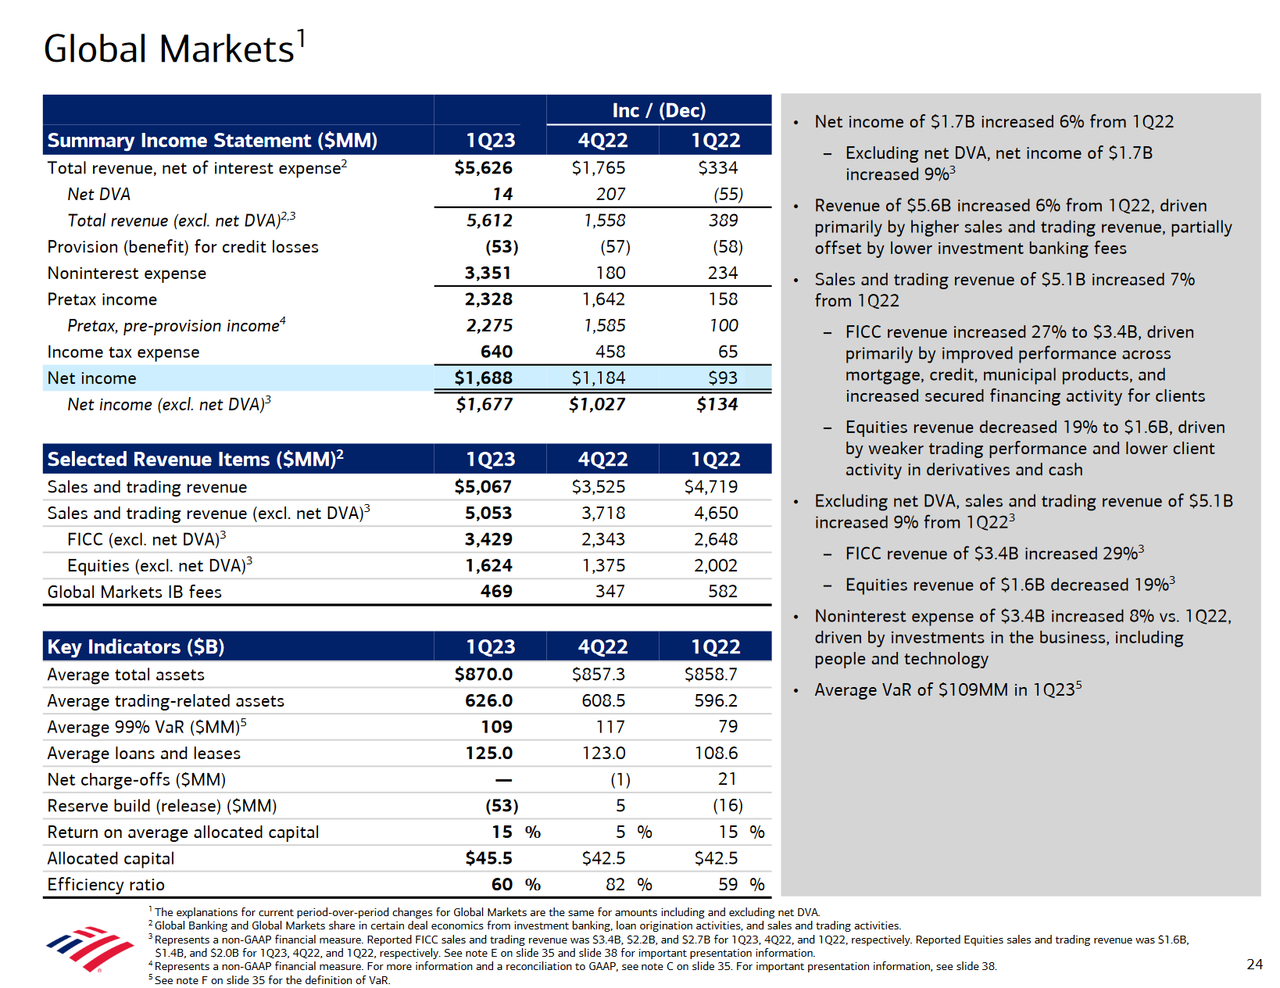
Some more details on Global Markets:
- Net income of $1.7B increased 6% from 1Q22; Excluding net DVA, net income of $1.7B increased 9%
- Revenue of $5.6B increased 6% from 1Q22, driven primarily by higher sales and trading revenue, partially offset by lower investment banking fees
- Of this, sales and trading revenue of $5.1B increased 7% from 1Q22
- FICC revenue increased 27% to $3.4B, "driven primarily by improved performance across mortgage, credit, municipal products, and increased secured financing activity for clients"
- Equities revenue decreased 19% to $1.6B, "driven by weaker trading performance and lower client activity in derivatives and cash"
- Markets noninterest expense of $3.4B increased 8% vs. 1Q22,driven by investments in the business, including people and technology
- Finally, the average VaR was $109MM in 1Q 23, down from %117 last quarter but up from 79 a year ago.
Finally, some highlights from the earnings release:
- BofA ended the quarter with $904B of Global Liquidity Sources
- BofA's consumer banking average deposits declined 3%
- BofA Q2 Consumer Banking Avg Deposits Remained Above $1 Trillion
- BofA Consumer banking client balances declined $33B, or 2%
- BofA Q1 Net Reserve Build $124M in Provision for Credit Losses
- BofA Q1 Consumer Banking Avg Deposits Declined $30B
- BofA net reserve build driven primarily by consumer
- BAC: Qtr Incl $220MM Pretax Loss on Sale of AFS Debt Securities
“Revenue growth reflected strong net interest income improvement coupled with one of our best quarters of sales and trading,” Chief Financial Officer Alastair Borthwick said in a statement Tuesday.
BofA's results offer another look at how iconic Wall Street banks fared through a tumultuous quarter that saw the collapse of three smaller, regional lenders. Last week, the mega banks, JPMorgan, Morgan Stanley, Citigroup and Wells Fargo, all posted gains in net interest income, with some also raising their forecasts for the rest of the year.
Shares of the Charlotte, North Carolina-based bank, which were down 8.3% this year through Monday, rose 2% at 8:30 a.m. in premarket trading and woud have been even higher if it hadn't been for ugly results out of Goldman.
(Click on image to enlarge)

More By This Author:
"It's Going To Be Ugly": Commercial Real Estate Predictions Turn DireAlphabet Shares Slide On Report Samsung Abandoning Google For Bing
Futures Flat In Quiet Session As Attention Turns To Company Earnings


Comments
Log in or sign up to join the conversation.