
(Click on image to enlarge)
In the long term, Alibaba Group Holding (BABA) seems to be forming a bearish trend.
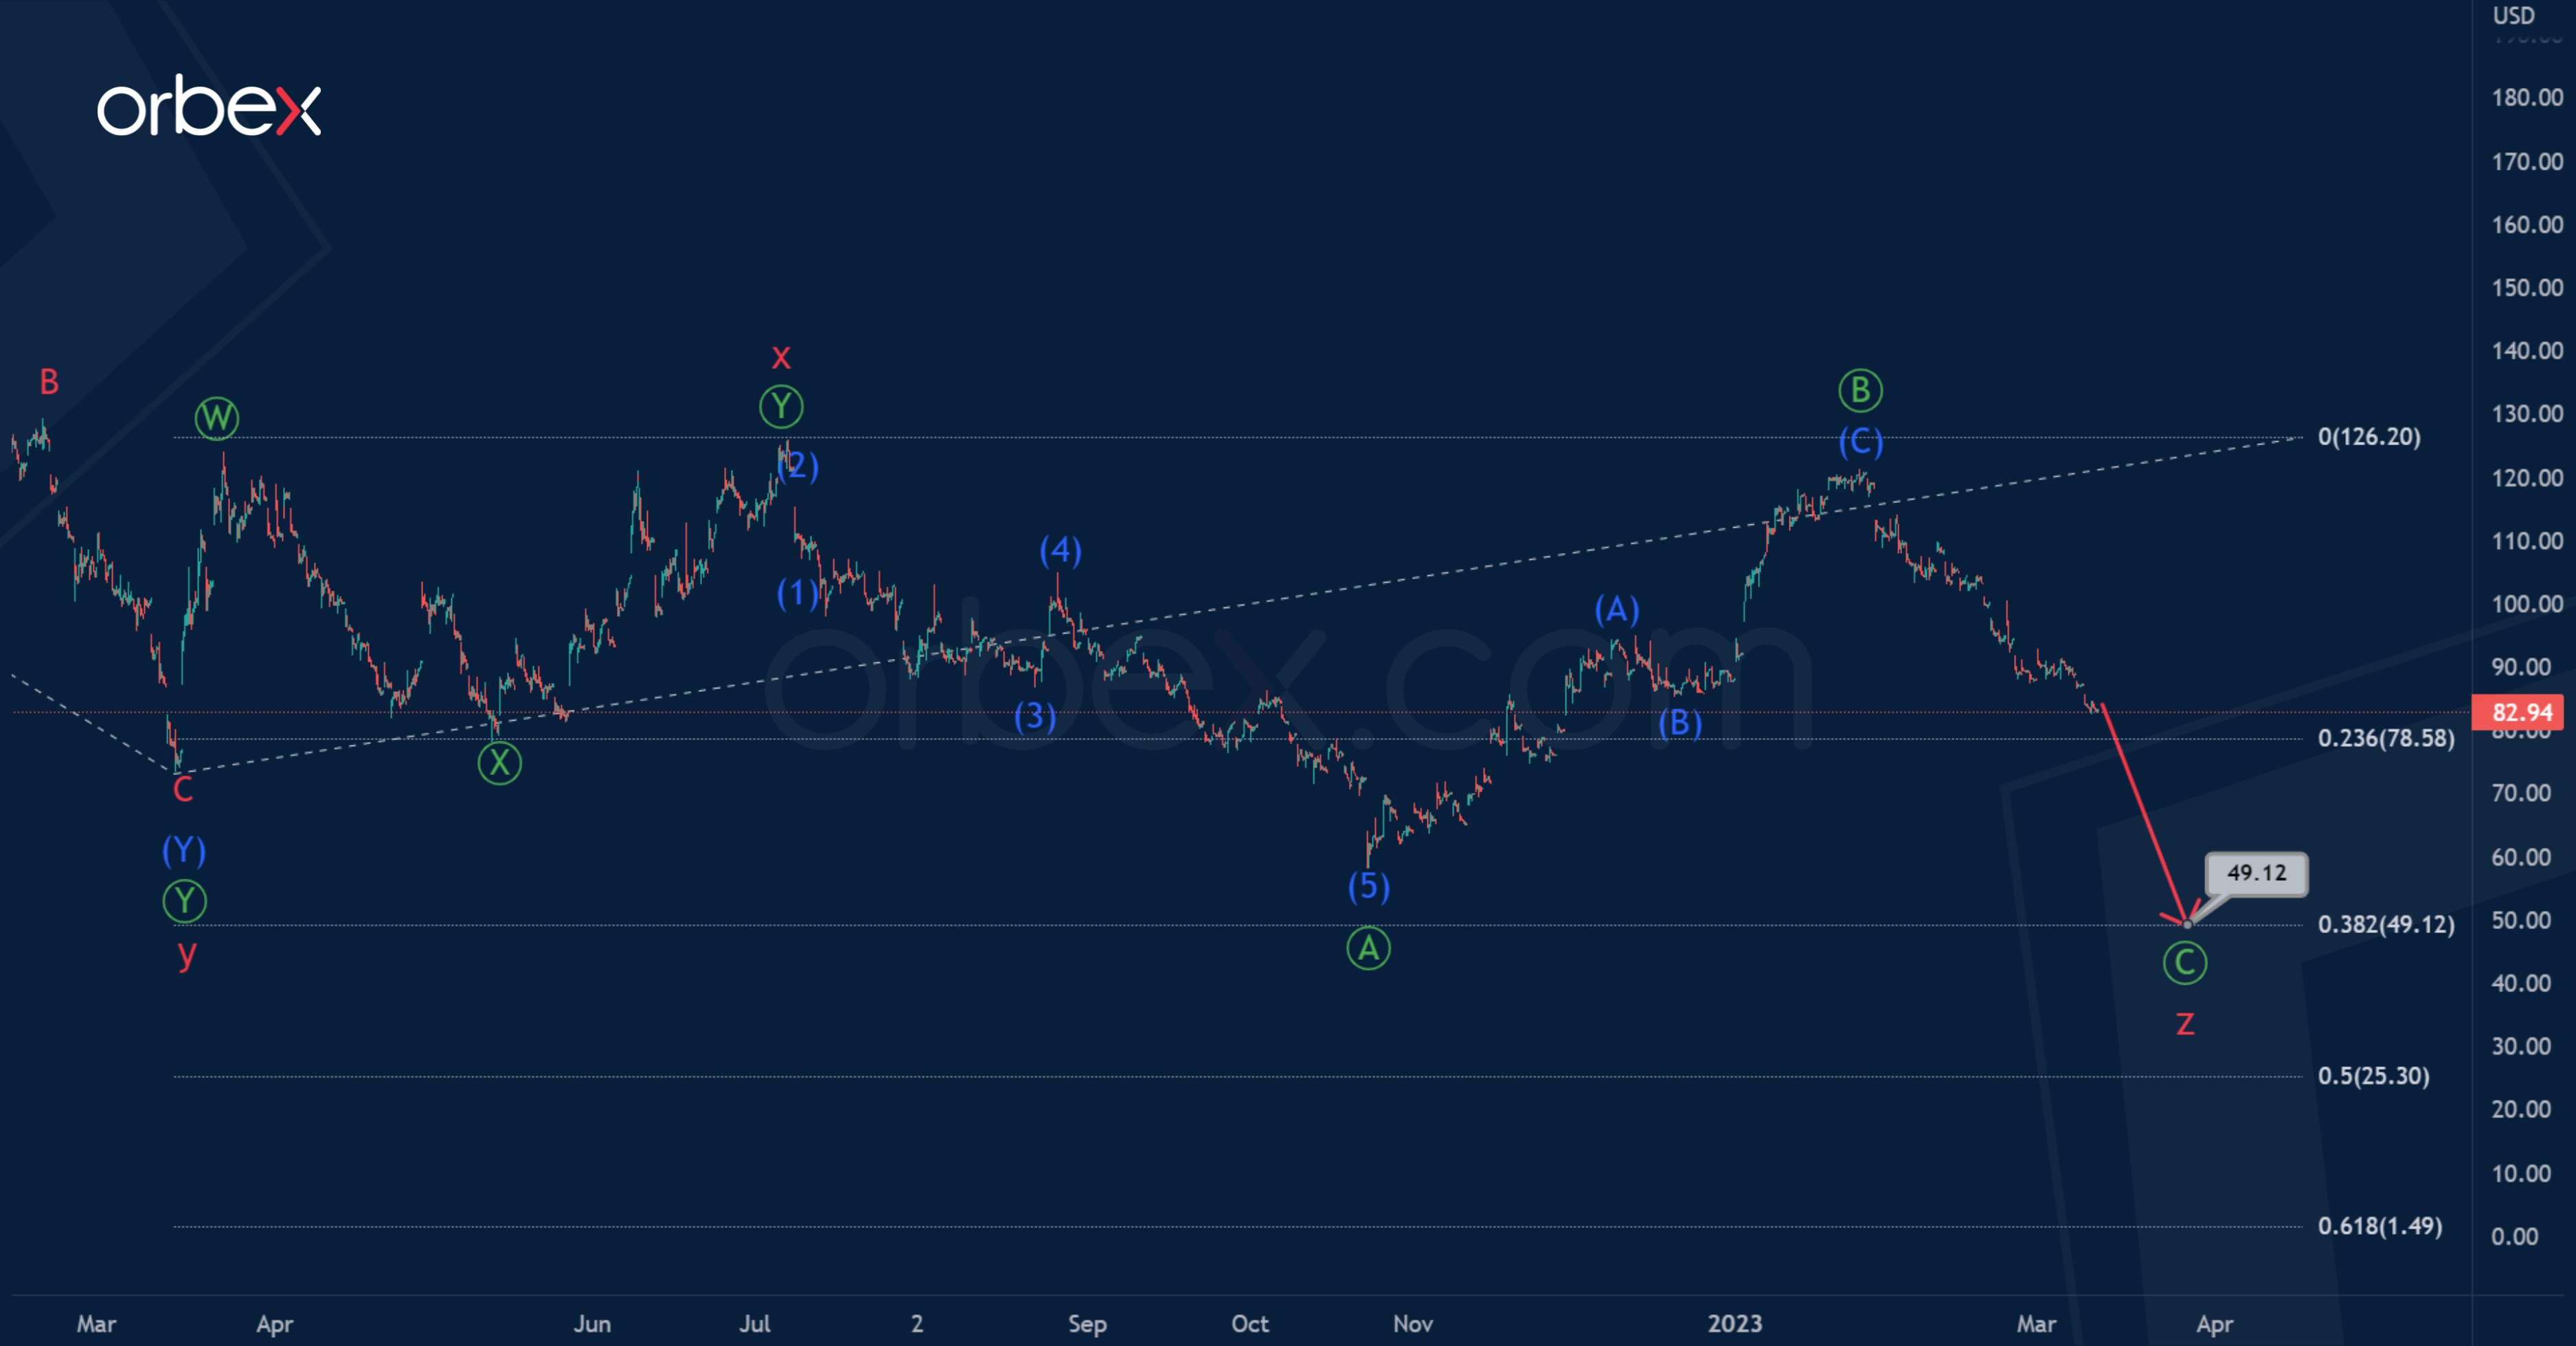
On the current chart, the completed actionary wave y and the second small intervening wave x are double zigzags.
At the time of writing, the formation of the final actionary wave z is taking place. This will likely take the form of a primary zigzag Ⓐ-Ⓑ-Ⓒ.
The primary impulse Ⓐ and correction Ⓑ have ended. So, we can expect a decline to 49.12 in the sub-wave Ⓒ. At the specified mark, wave z will be 38.2% of wave y.
(Click on image to enlarge)
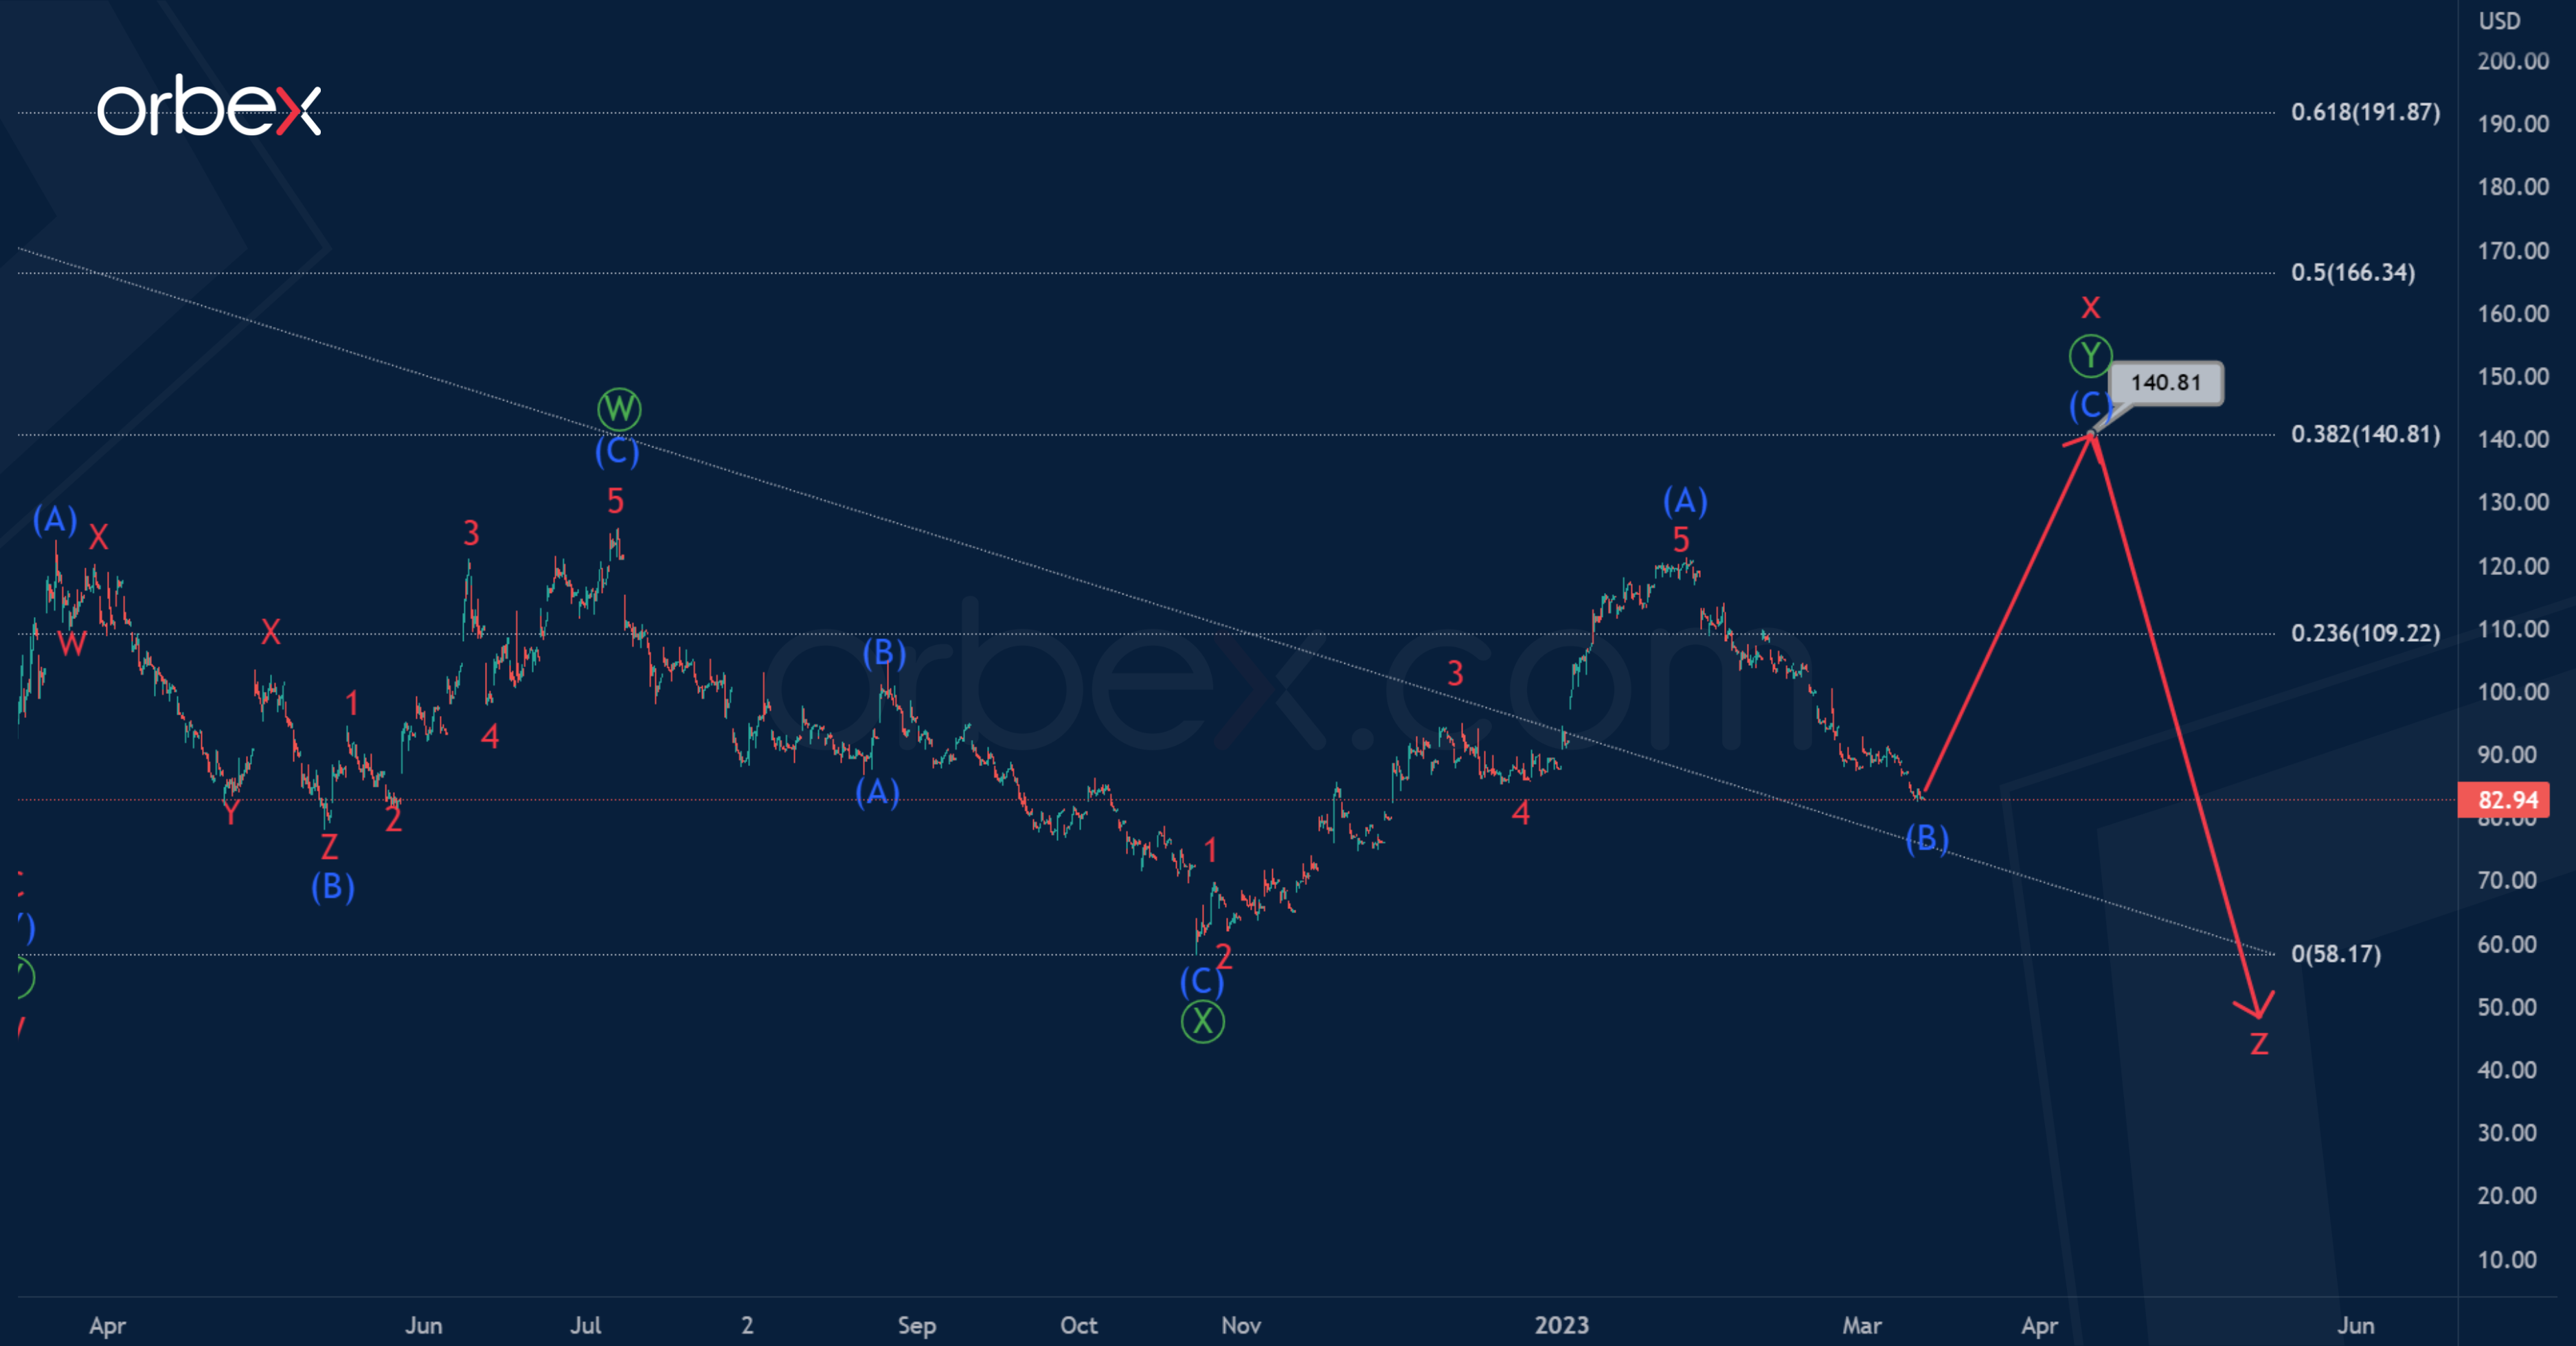
In the second variant of the markup, we see the continuation of the intervening wave x. This will be a double zigzag of the primary degree Ⓦ-Ⓧ-Ⓨ. The first two zigzag sub-waves Ⓦ-Ⓧ look finished.
Most likely, wave Ⓨ could take a zigzag structure of the intermediate degree (A)-(B)-(C), as shown in the chart. Impulse (A) and correction (B) look formed.
The price growth in the intermediate wave (C) can reach 140.81. At that level, cycle intervening wave x will be at 38.2% of actionary wave y.
More By This Author:
Intraday Analysis – USD Struggles For Bids
How Worried Should Forex Traders Be Over The SVB Crisis?
NZDUSD Decline In The Final Zigzag Ⓑ

Comments
Log in or sign up to join the conversation.