
Summary
- AZO’s price pattern is closely related to the business cycle.
- AZO outperforms the market when business slows down.
- AZO will continue to outperform the market.

Photo by Laurel and Michael Evans on Unsplash
AutoZone, Inc. retails and distributes automotive replacement parts and accessories. The company offers various products for cars, sport utility vehicles, vans, and light trucks, including new and remanufactured automotive hard parts, maintenance items, accessories, and non-automotive products. As of November 20, 2021, it operated 6,066 stores in the United States; 666 stores in Mexico; and 53 stores in Brazil. The company was founded in 1979 and is based in Memphis, Tennessee (AZO).
(Click on image to enlarge)
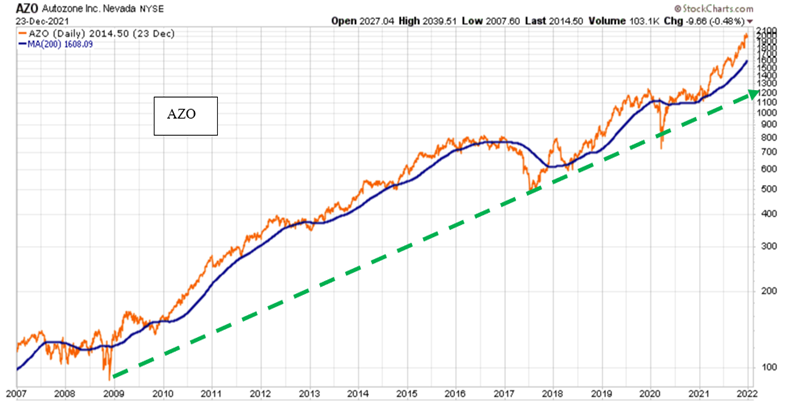
Source: StockCharts.com, The Peter Dag Portfolio Strategy and Management
The performance of AZO’s stock confirms it has been a great investment. The issue is whether AZO is still attractive now as a strategic investment. Will AZO keep performing if the economy slows down as many analysts expect?
The price pattern of AZO compared to the S&P 500 is particularly telling when matched to its behavior during previous business cycles.
(Click on image to enlarge)
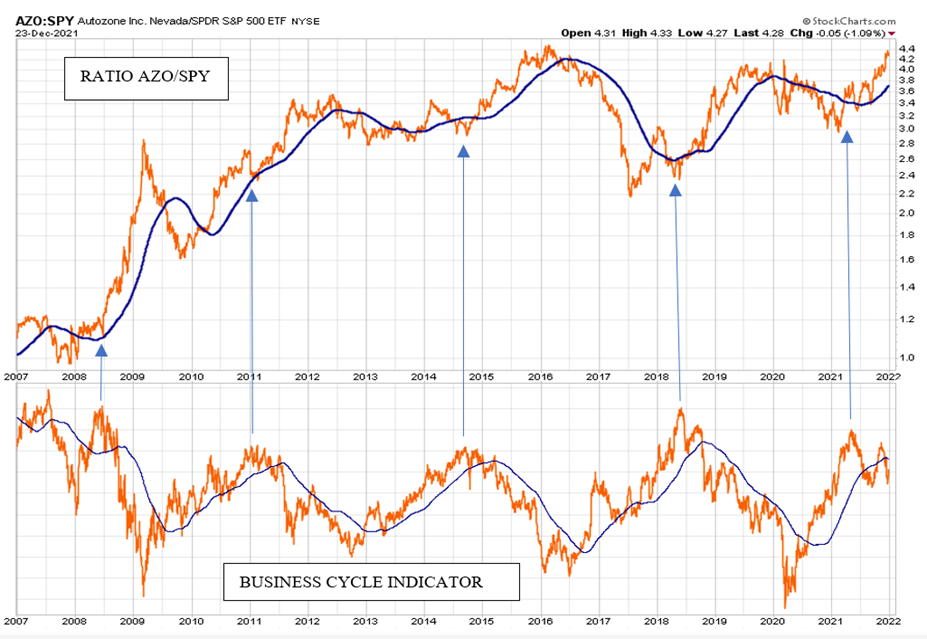
Source: StockCharts.com, The Peter Dag Portfolio Strategy and Management
The above chart shows two panels. The graphs in the above panel represent the ratio between AZO and SPY. The second graph is its 200-day moving average. The graphs rise when AZO outperforms SPY. The graphs decline when AZO under-performs SPY. Investors are going to outperform the market if they invest in AZO when the graphs rise.
The bottom panel shows the business cycle indicator, a proprietary gauge updated regularly in The Peter Dag Portfolio Strategy and Management. This indicator is computed in real-time from market data. Its turning points coincide also with the cyclical turning points of the growth of employment in manufacturing and credit spreads.
The relation of AZO to the business cycle is quite telling. AZO outperforms the market when the business cycle declines, reflecting slower economic growth. The above chart shows the ratio AZO/SPY rises, reflecting the outperformance of AZO relative to SPY when the business cycle declines.
The recent weakness in the business cycle indicator suggests AZO will continue to outperform SPY (the ratio will keep rising).
(Click on image to enlarge)
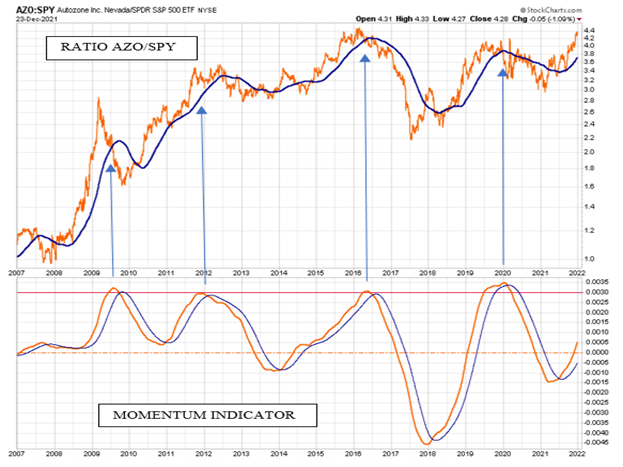
Source: StockCharts.com, The Peter Dag Portfolio Strategy and Management
The above chart shows AZO’s momentum indicator just bottomed, suggesting the ratio AZO/SPY is likely to rise and AZO to outperform SPY.
Key takeaways
- The business cycle will decline, reflecting slower economic growth. The slowdown is mostly driven by the decline in disposable personal income after inflation.
- AZO will continue to outperform SPY as long as the business cycle indicator declines.
- The business cycle indicator will rise when inflation declines. At that time real disposable income will also rise accompanied by improving consumer sentiment (University of Michigan survey).


Comments
Log in or sign up to join the conversation.