Assessing The Construction Sector's Favorable Earnings Outlook
Image Source: Unsplash
The earnings picture defied the skeptics again in the 2023 Q1 earnings season, with companies not only handily beating estimates but also providing reassuring enough guidance for the current coming quarters.
We are not suggesting that earnings are great because they are not. After all, earnings growth is on track to be negative for the second quarter in a row, with the trend of declining profits expected to continue in the current period (2023 Q2) as well as the one after that.
We tend to dwell a lot on the Technology and Finance sectors as we look for earnings trends in the aggregate, as these two sectors combined account for so much of the total earnings pie. Over the coming four quarters, these two sectors are expected to bring in 44% of all S&P 500 earnings. As such, what happens in these two sectors significantly impacts the aggregate growth picture.
The focus of today’s report is to feature the earnings outlook of the Zacks Construction sector, one of the stand-alone Zacks economic sectors that we feel differentiates us from the conventional sector classification (we have 16 sectors vs. the 11 sectors in the ‘standard’ system).
As an interest rate-sensitive sector, the Construction sector’s profitability has been significantly affected by higher interest rates as a result of Fed tightening. The sector’s earnings this year are currently expected to decline by -21.8%, which would follow earnings growth of +21.5% in 2022, +45% in 2021, and +24.5% in 2020.
The chart below shows the Zacks Construction sector’s earnings on an annual basis, with 2023 earnings on track to reach $21.3 billion, down from $27.2 billion in 2022 and $22.4 billion in 2021.
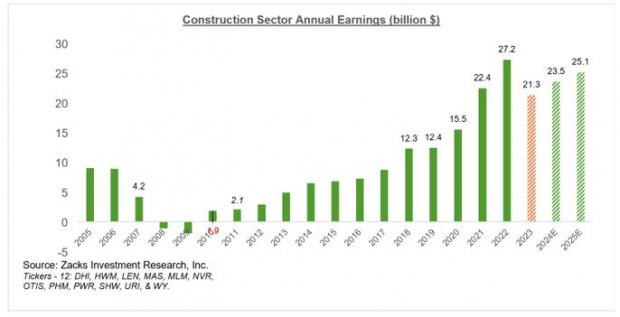
Image Source: Zacks Investment Research
But as you can see in this chart, the sector’s profitability outlook is not only stable but actually positive. This favorable earnings outlook also comes through when we look at the sector’s earnings estimate revisions trend, which turned positive recently after remaining negative since April 2022.
In fact, 2023 earnings estimates for the sector got cut the most out of all Zacks sectors as the full extent of the Fed’s tightening cycle took hold last year. From their peak in April last year, 2023 earnings estimates for the Zacks Construction sector have been cut by almost -27%.
The Construction sector was hardly alone in experiencing this negative revisions trend, as estimates for most sectors adjusted lower over this time period.
However, the Construction sector has been notably experiencing a trend reversal lately, with estimates for the group notably moving higher since the start of April 2023.
You can see this recent favorable turn in the revisions trend by looking at the individual companies in the Zacks Construction sector, of which the 12 that are in the S&P 500 index are listed in the bottom left of the chart above. Take, for example, homebuilders D.R. Horton (DHI - Free Report), PulteGroup (PHM - Free Report), and NVR (NVR - Free Report).
D.R. Horton is currently expected to bring in $11.18 per share this year on $32.3 billion in revenues. The current $11.18 per share estimate is up +23.2% since March 31st, as the chart below shows.
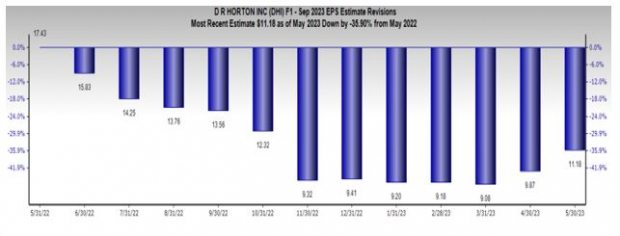
Image Source: Zacks Investment Research
As you can see in the D.R. Horton chart above, current estimates are down significantly relative to where they stood a year ago, but they are nevertheless starting to trend up. We see the same trend at play with PulteGroup, NVR, and others.
Using PulteGroup as an example, the current estimate for 2023 of $9.05 per share is up +21.6% since March 31st, while the same for NVR is up +7.4% over the same time period.
Knowing this recent favorable turn in the group’s earnings estimate revisions trend puts the group’s stock market outperformance in the correct context. You can see this in the one-year performance chart of PulteGroup vs. D.R. Horton vs. NVR and the S&P 500 index below.
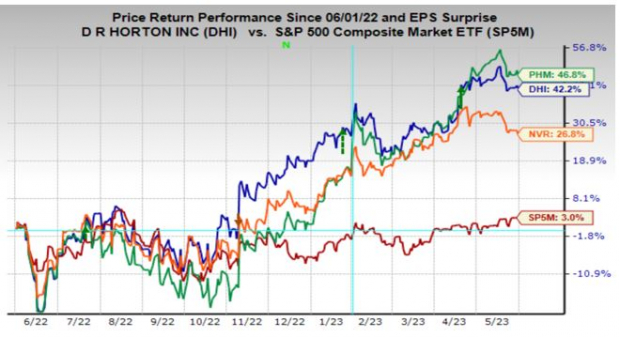
Image Source: Zacks Investment Research
The Earnings Big Picture
The chart below provides a big-picture view of earnings on a quarterly basis. The growth rate for Q1 is on a blended basis, where the actual reports that have come out are combined with estimates for the still-to-come companies.
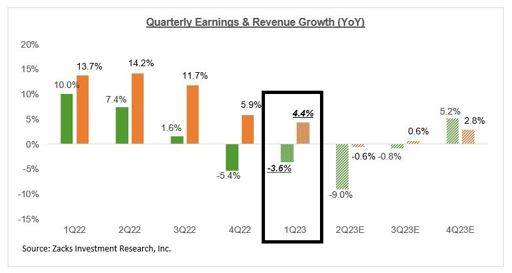
Image Source: Zacks Investment Research
The chart below shows the overall earnings picture on an annual basis.
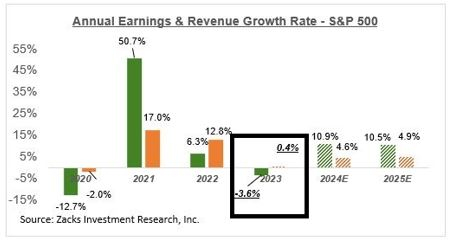
Image Source: Zacks Investment Research
As we have pointed out all along, aggregate earnings estimates for 2023 peaked in April last year and consistently came down since then. Even accounting for the aforementioned favorable revisions trend in recent weeks, aggregate 2023 earnings estimates have declined by -13.2% since the April 2022 peak and -14.6% on an ex-Energy basis.
Hard to tell at this stage if the revisions trend will remain on its recent positive trajectory or revert back to its original negative trend. But it is nevertheless a market-friendly development.
More By This Author:
Q1 Earnings: Can Artificial Intelligence (AI) Sustain Momentum?
Dissecting Retail Earnings And Shifting Consumer Spending Trends
Key Takeaways From The Q1 Earnings Season
Disclosure: Zacks.com contains statements and statistics that have been obtained from sources believed to be reliable but are not guaranteed as to accuracy or completeness. References to any specific ...
more


