
As Inflation Soars, So Does The S&P 500 Intrinsic Value
“Davidson” submits:
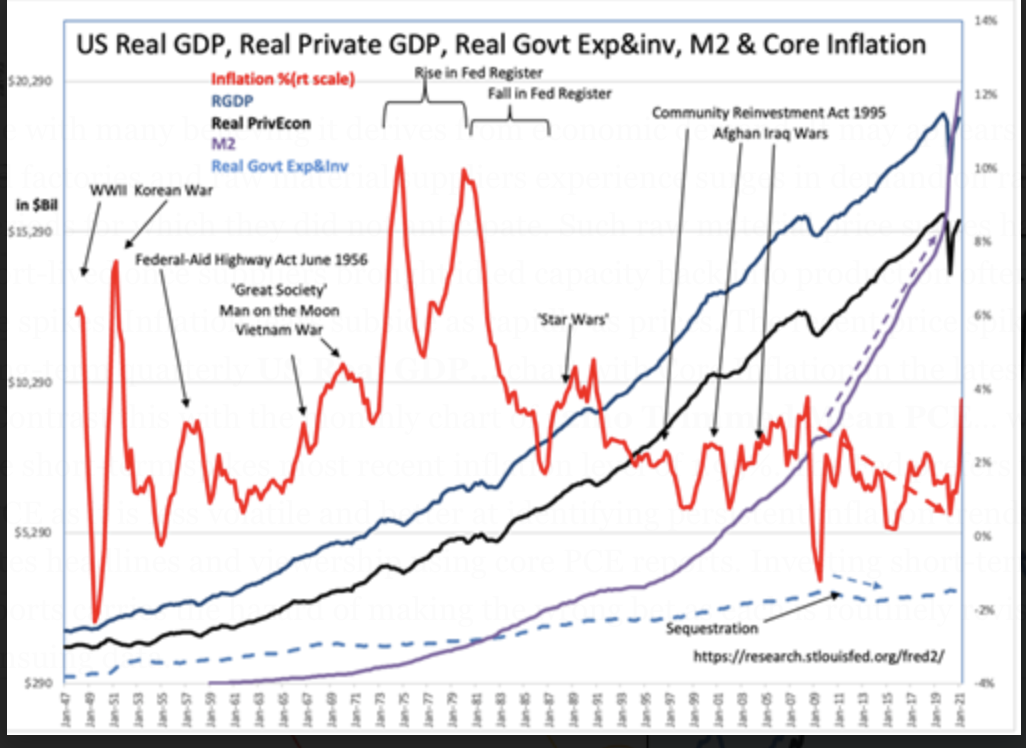
Inflation is a puzzle with many believing it derives from economic demand. It may appear so when under-inventoried factories and raw material suppliers experience surges in demand on rapid exits from recession periods for which they did not anticipate. Such raw material price surges have always proved short-lived once suppliers brought idled capacity back into production often within a few weeks of price spikes. Inflation fears subside as rapidly as prices. The recent price spike is revealed in the long-term quarterly US Real GDP… chart with Core Inflation in the latest quarterly report of 3.79%. Contrast this with the monthly chart of 12mo Trimmed Mean PCE… which is designed to ignore short-term spikes most recent inflation level of 1.95%. The Fed prefers the 12mo Trimmed Mean PCE as it is less volatile and better at identifying persistent inflation trends while the media generates headlines and viewership using core PCE reports. Investing short-term on either of these reports carries the hazard of making the wrong bet as each is routinely revised backwards with ensuing data.
(Click on image to enlarge)
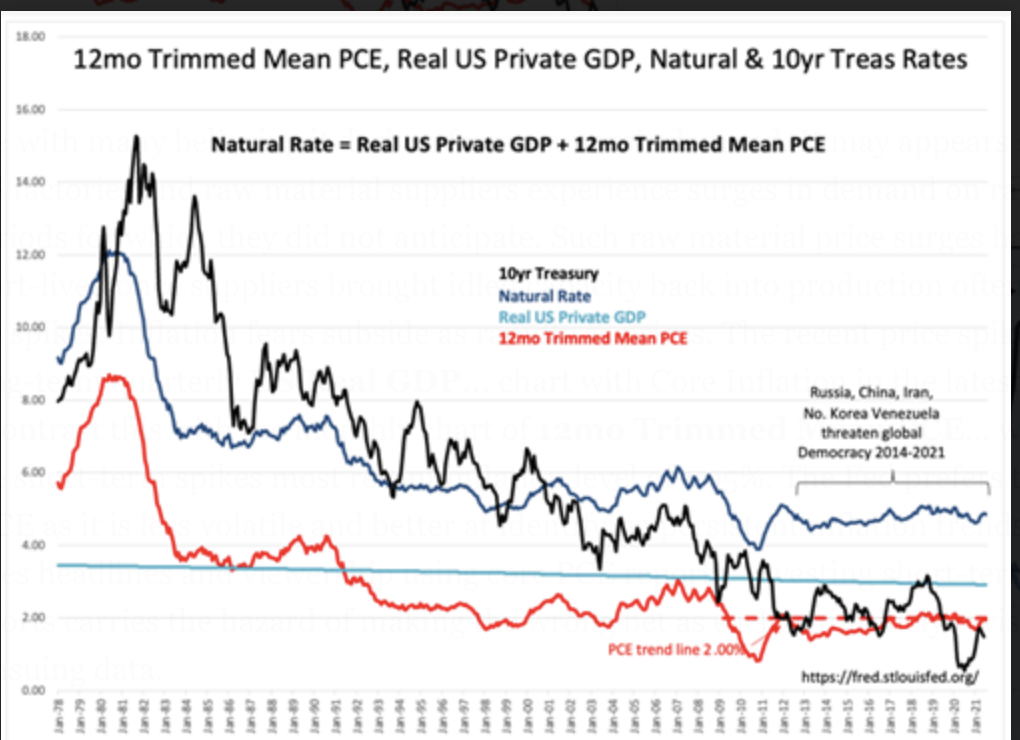
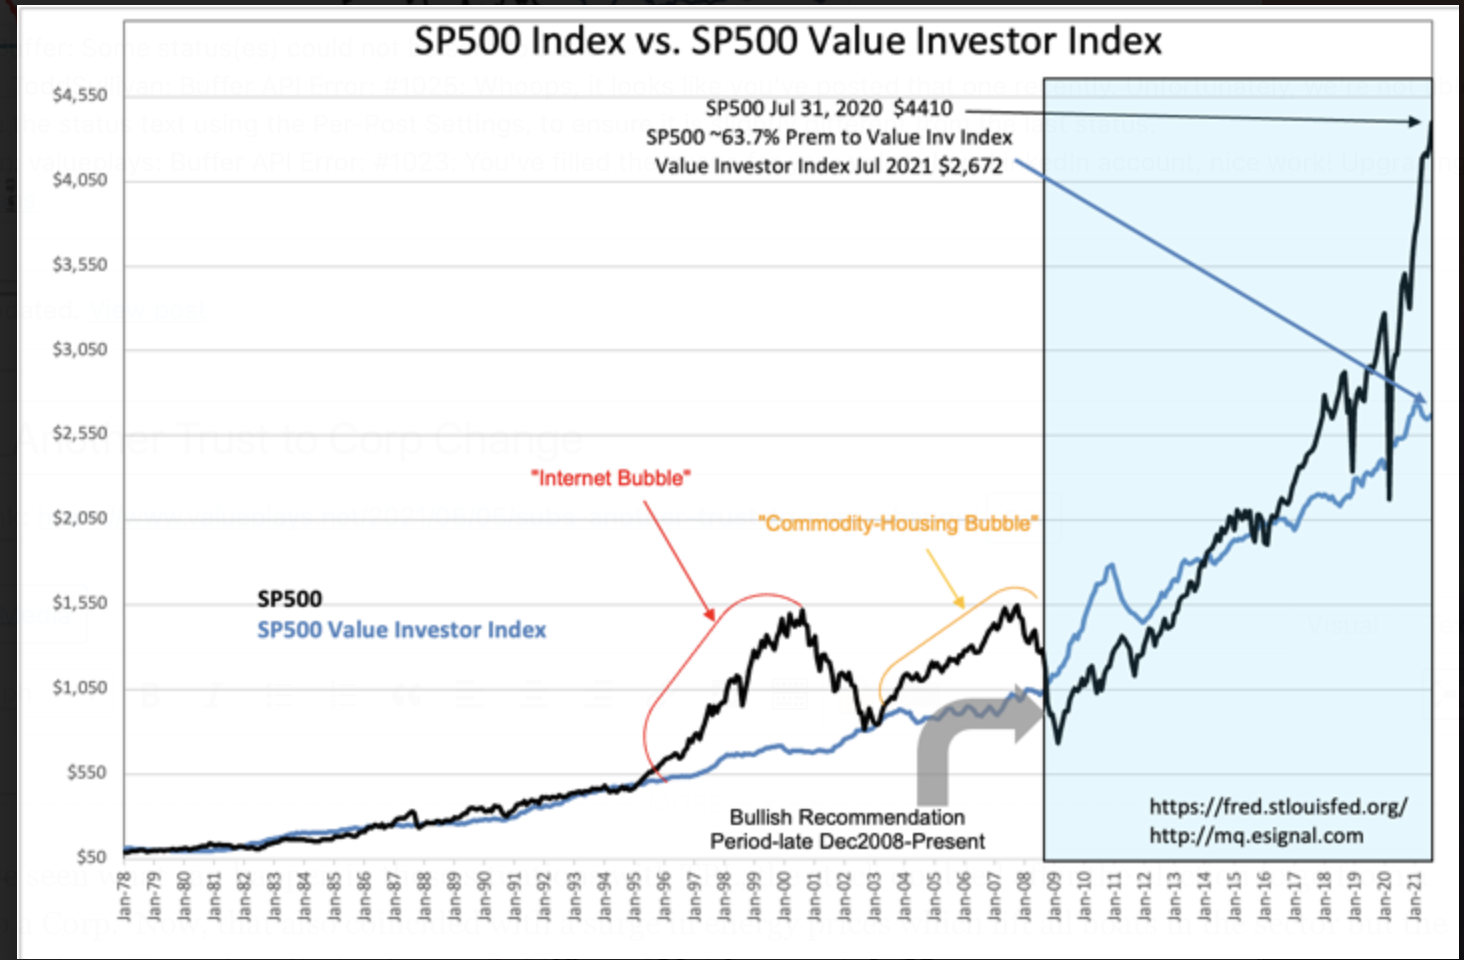
That the 12mo Trimmed Mean PCE is not as volatile and revised less than the other inflation measures makes it better for long-term fundamental valuation measure of the SP500 referred to as the Value Investor Index. This index takes the median long-term earnings trend of the SP500(a 6.1% growth trend from 1947-Present) and capitalizes this trend using the Real Private GDP(Real GDP minus Government Expenditure&Invest) and the 12mos Trimmed Mean PCE. The volatility in the 12mo Trimmed Mean PCE, being in the denominator of the capitalization equation, makes the Value Investor Index somewhat volatile as seen in the SP500… chart. Higher inflation lowers the fundamental price investors should pay for the SP500 earnings trend for long-term investors.
(Click on image to enlarge)
The one lesson most seem to miss is that inflation does not occur from economic expansion. Economic expansion is disinflationary. Consumers always seek to lower the cost of living by acquiring the cheapest, the fastest, the best quality, best value for their earnings. Consumer spending is always disinflationary in my assessment. What has always been inflationary is government spending and its impact on M2. M2 has soared ~40% from Jan 2019. It is when M2 outpaces Real Private GDP growth that inflation soars. Real Private GDP growth is 2.91%. A 40% rise in M2 guarantees a period of high inflation going forward unless we see a reversal in the current political decision-making and government spending.
The SP500 Value Investor Index is a long-term valuation measure not designed for short-term trading. It is based on Knut Wicksell’s 1898 observations that there was a long-term rate of return over multiple economic/market cycles that tended to reflect what investors were willing to pay for earnings. Deviations from this fundamental rate of return were a function of short-term market psychology. The Value Investor Index is far more useful for identifying when market prices are attractive relative to long-term returns, i.e. good buying opportunities, than in identifying market tops. Currently, the SP500 is priced at ~64% premium to the Value Investor Index with a recent history of market tops 2000 and 2007 at 100% and 65% premium levels.
While the past does provide some guidance, every market is different with the current market no exception. The US has been flooded with foreign capital under control of very inexperienced investors. The rise in the US$ reflects a capital shift the last 10yrs+ which has resulted in a rise in price trend following as an investment approach. The last 10yrs have seen enormous inflation in prices of theme investments from Global Warming and Bitcoin to digital art resulting in one notable investor from Asia cashing out $60mil+ of Bitcoin to buy a collage in a first-ever NFT and believe it was undervalued. IPOs, SPACs, tech offerings, and issues connected to Global Warming themes have routinely been priced at 50x Revenue with negative cash flows and eps. Companies such as GameStop and AMC, with high short interest on the belief that bankruptcy was imminent, soared many-fold with groups of inexperienced investors on social media, ‘Gamer-investors’, coordinating short-squeezes against the shorts reminiscent of Jesse Livermore of the 1920s. This type of investor is now dominating the news and likely pricing
So, this begs the question, “What happens when companies produce a true stream of earnings gains not expected by these investors?” Reuters reports we have entered such a period.
AUGUST 3, 20216:00 AM
U.S. company profits even bigger than Wall Street’s lofty targets
“Earnings are now expected to have climbed about 90% in the second quarter versus analysts’ forecasts of 65.4% at the start of July, according to IBES data from Refinitiv, with results in so far from roughly 300 of the S&P 500 companies as of Monday morning. Nearly 89% of the reports are beating analysts’ second-quarter profit estimates – the highest percentage on record, based on Refinitiv data going back to 1994.”
How high can stocks soar with real earnings being reported as better than expected day after day, for multiple quarters? The answer when investors are chasing every opportunity as if it will be their last opportunity to profit is “Higher than one may imagine!” One can only use past experience to guess at a novel situation. My guess is the SP500 is likely to exceed all prior premium levels to the Value Investor Index. It appears we are headed towards a repeat of the 1980s “Japan Inc” market bubble but now it is likely to occur in the US with foreign investors allocating their risk capital.
The earnings surprises we have today are real with important economic indicators signaling several years of continued economic expansion lay ahead. The key to an economic top remains the yield curve even though it has been skewed by foreign capital trends frequently driving down 10yr rates and panicking algorithm traders. The true signal for a market top is when T-Bill rates rise to 10yr rate levels indicating both market and business investors are all in leaving them with no reserve to wait out a rainy day. When that occurs and economic correction follows. It has been a solid signal since 1953.
Disclaimer: The information in this blog post represents my own opinions and does not contain a recommendation for any particular security or investment. I or my affiliates may hold positions or ...
more


The charts are a bit blurry.