
It’s been a rough go-around for stocks and investors. But will it get worse before it gets better?
Let’s turn to Joe Friday for “The facts, Ma’am. Just the facts.”
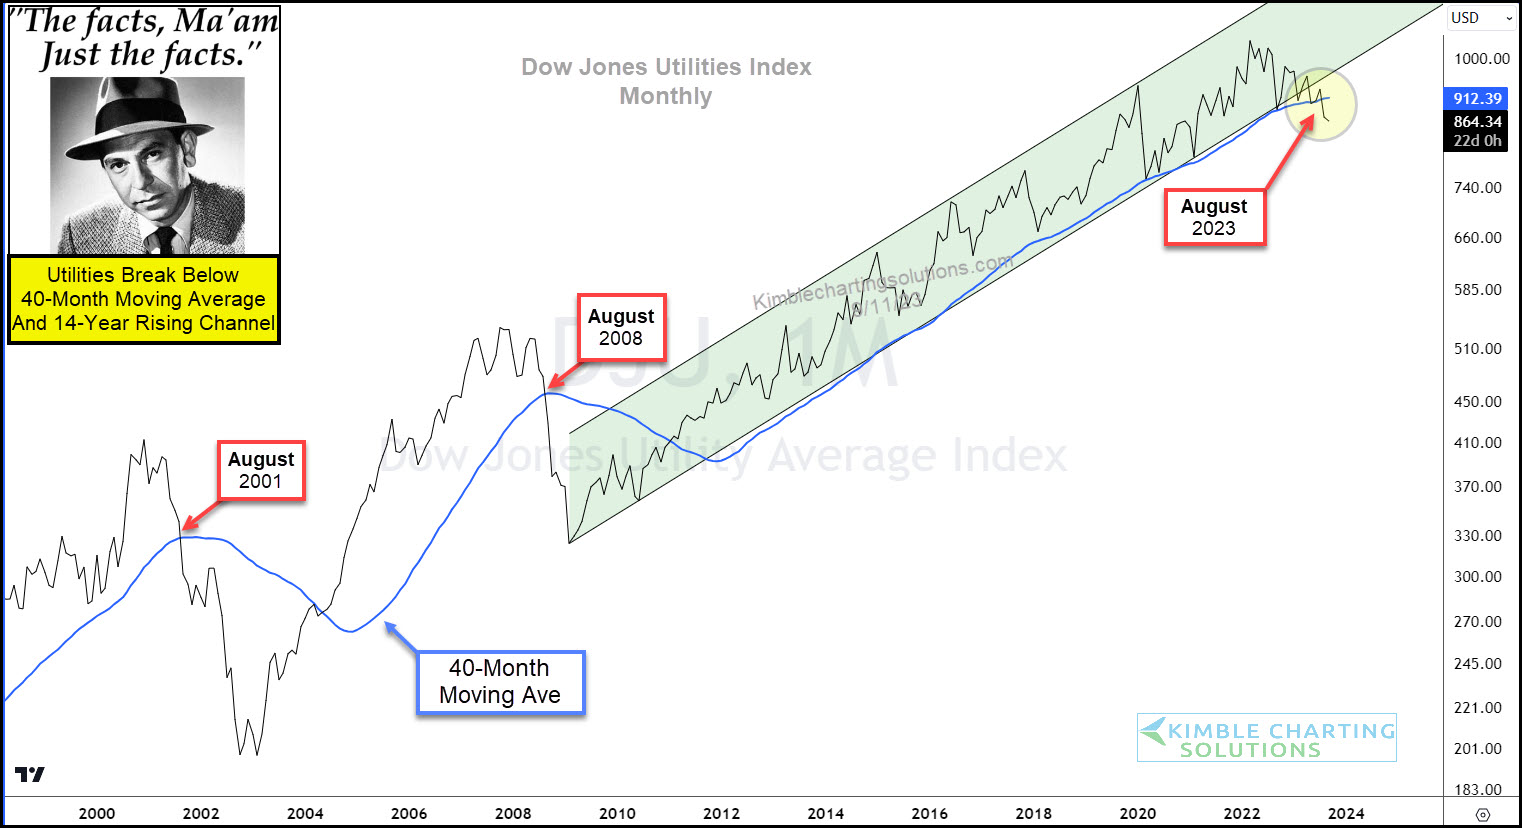
Today’s chart features a “monthly” view of the Dow Jones Utilities Index.
And, as you can see, the chart is very straightforward and telling.
For the first time in 15 years, the Dow Jones Utilities Index DJU has broken below its 40-month moving average.
The past two times it did this were also in August. And both lead to considerable losses. More pain ahead for stocks?
(Click on image to enlarge)
More By This Author:
Will Semiconductors Double Top Take Stocks Down?
Can Tech Stocks Fight Through “Lower Highs” Resistance?
China’s Shanghai Composite Stock Index Nearing “Decision Time”


Comments
Log in or sign up to join the conversation.