
In last week's meandering market missive, I opined that "the next major trend - in either direction - is likely to be driven by the outlook/expectation for the state of the economy". While I will admit that this isn't exactly a groundbreaking analysis, I continue to believe this is the key to understanding the current big-picture market environment.
So far at least, the stock market appears to be looking ahead to better days. To a time when the Fed isn't the enemy. To when the inflation bogeyman has slunk back into the shadows. And to a time when recession is not the widely expected outcome for the U.S. economy.
How else do you explain the impressive gains seen in the major indices in 2023? Doing some quick math, I find that the S&P 500 (using SPY as a proxy) is up +6.1% year-to-date, Small caps (IWM) have advanced +8.7%, Mid caps are up +7.8%, and the much-maligned Nasdaq 100 (QQQ) sports an eye-popping return of +11.3% so far in the new year. Not too shabby, eh?
Our furry friends in the bear camp are quick to pooh-pooh the notion that stocks are looking ahead and suggest that the current market rally is merely another in what is already a long string of oversold reactions - aka a bear market bounce.
Those seeing the market's glass as at least half empty tell us that just about every indicator on the planet is SCREAMING that the good 'ol USofA is either in, or about to enter, a recession. And lest we forget, those donning their bear costumes remind us the stock market returns during bear markets which are accompanied by a recession have been much worse that those that weren't. As such, the bears contend the major indices are destined to move lower as the year progresses.
One of the VERY strong arguments for the Negative Nancys' recession case making the rounds this week was the latest update to the Conference Board's Index of Leading Economic Indicators (LEI). Unfortunately, the latest reading of the LEI fell -1% for the month. This was well below the consensus expectations for a drop of -0.7%, marked the 3rd straight monthly decline of at least -1%, and is off -7.4% year-over-year. And for those of you keeping score at home, the December reading marked the 10th consecutive month the venerable indicator had declined. None of which sounds good.
In a note to clients, Deutsche Bank's Jim Reid informed us that since 1959, every time the LEI has dropped more than 1% year-over-year, a recession has hit in the subsequent months. And as Jim points out, "There are no false positives."
The chart below makes Mr. Reid's point quite clear. I've drawn in a horizontal red line to highlight the fact that whenever the LEI has fallen to the degree it has currently, a recession has indeed occurred.
Conference Board's Index of Leading Economic Indicators
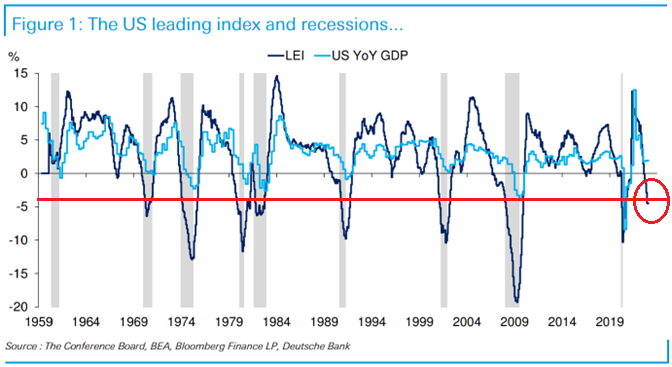
Image Source: Deutsche Bank, Conference Board
Are We Already In Recession?
This chart along with the history of inverted yield curves and some others are giving credence to the cry that the U.S. is already in recession. Fair point.
MKM Partners' Michael Darda summed up the current state of the economy nicely by saying, "It would now appear that three of four NBER business cycle indicators have peaked for this cycle, with employment as the lone survivor."
The thinking is that the jobs market is keeping the economy afloat/out of recession right now as both the manufacturing and services sectors are in decline to varying degrees. And since the consumer represents something on the order of 70% of all economic activity, the argument is you can't have a recession when everybody has a job and cash in the bank.
So, even the most ardent bulls are forced to admit that IF the economy starts to shed jobs across the board (so far at least, the bulk of the job losses have been occurred in the technology sector), then a recession is at hand.
And this is the reason, dear readers, that Friday's jobs report carries the usual amount of significance. Cutting to the chase, a good report pushes the idea of recession to the back burner whereas a report sporting job losses will give the bear camp some serious ammunition.
On the Other Hand...
On the other sideline, our heroes in horns have a different take on what is happening here. The bull camp has a number of talking points they are looking to promote these days including: (a) rates, the dollar, and prices (and in turn, inflation) are all falling, (b) China is reopening quickly and economic stimulus is likely on the way, (c) labor markets remain strong, (d) the Fed will be moving toward the sidelines soon, (e) supply chain pressures are normalizing, (f) Europe's economy is hanging in there, (g) lots of cash in both consumer and corporate balance sheets, and (h) the technical picture is improving.
That last point is worth expanding on a bit. Unlike the prior bear market bounces we've seen, the current move appears to have some oomph behind it. While the bulls are most definitely not out of the woods and technical confirmations (such as a "higher high" on the charts) are needed, it is worth noting that our major market models are improving nicely.
Oh, and don't look now fans, but the dips are being bought on an intraday basis right now. To be sure, this situation could turn on a dime. But as we've been saying, the "tenor" of the market has definitely improved.
In addition, some of my favorite longer-term models have flashed buy signals of late. One of which is Ned Davis Research's Leading Indicators model. Not to be confused with the Conference Board's LEI, this is a model containing 10 indicators that have historically "led" the stock market. (For the indicator geeks out there, the components of the model include analysis of: Utilities, Financials, Volume Demand, A/D Line, Daily Momentum Model, Co Lag, Weekly % New Highs, Big Mo Multicap, Moody’s BAA Yield, Bulls-Bears Sentiment.)
I've worked with this model for many years and while nothing is perfect in this business, the model has done a VERY good job at times of calling the next big move in the market - ahead of time, of course. Take a look at the chart below (courtesy of Ned Davis Research).
NDR Leading Indicators Model
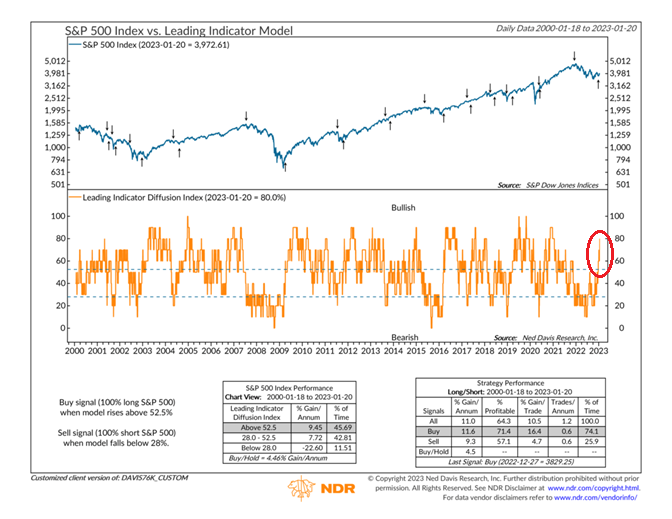
Image Source: Ned Davis Research Group
Note the timely sell signals that occurred in December of 2021, 2015, 2011, and the big one in 2007. Also note the string of solid buy signals that have been given in the last 23 years.
It will suffice to say that when this model "talks," I tend to listen. And while the direction of the market will likely be dictated by the state of the economy in the coming months, this model tells me to give the bulls the benefit of the doubt here and/or to get longer in my exposures.
So, is this the start of a new bull market or merely another frustrating bounce? From my seat, the odds favor the former. But the latter definitely cannot be ruled out. As such, the plan has been to increase exposure as the weight of evidence improves - and remain alert to any sudden changes in the "tenor" of the action.
Now let's review the "state of the market" through the lens of our market models...
Primary Cycle Models
Below is a group of big-picture market models, each of which is designed to identify the primary trend of the overall "state of the stock market."
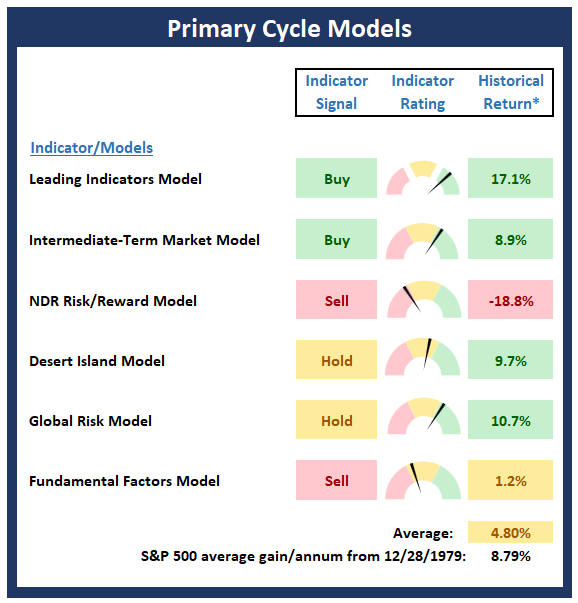
* Source: Ned Davis Research (NDR) as of the date of publication. Historical returns are hypothetical average annual performances calculated by NDR.
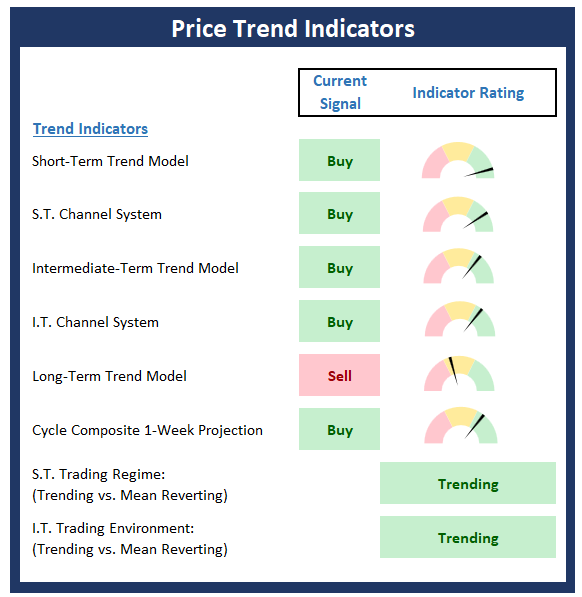
Trend Analysis
Below are the ratings of key price trend indicators. This board of indicators is designed to tell us about the overall technical health of the market's trend.
Key Price Levels
- S&P 500 Near-Term Support Zone: 4020
- S&P 500 Near-Term Resistance Zone: 4102
- S&P 500 50-day Simple MA: 3943
- MA Direction: Rising
- S&P 500 200-day Simple MA: 3958
- MA Direction: Declining
Market Momentum Indicators
Below is a summary of key internal momentum indicators, which help determine if there is any "oomph" behind a move in the market.
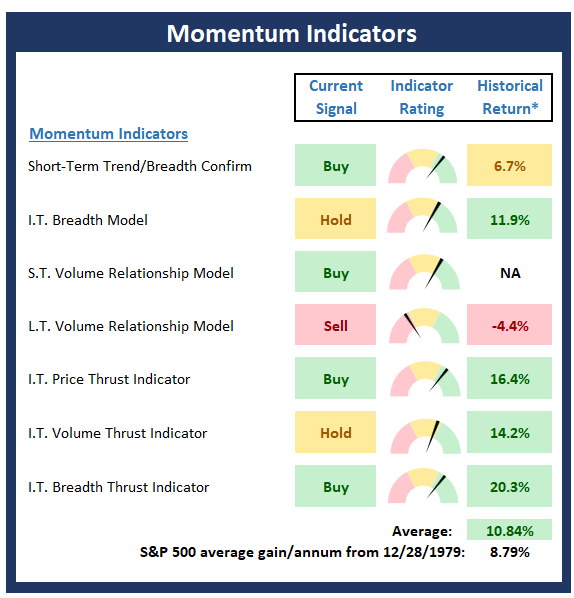
* Source: Ned Davis Research (NDR) as of the date of publication. Historical returns are hypothetical average annual performances calculated by NDR.
Early Warning Indicators
Below is a summary of key early warning indicators, which are designed to suggest when the market may be ripe for a reversal on a short-term basis.
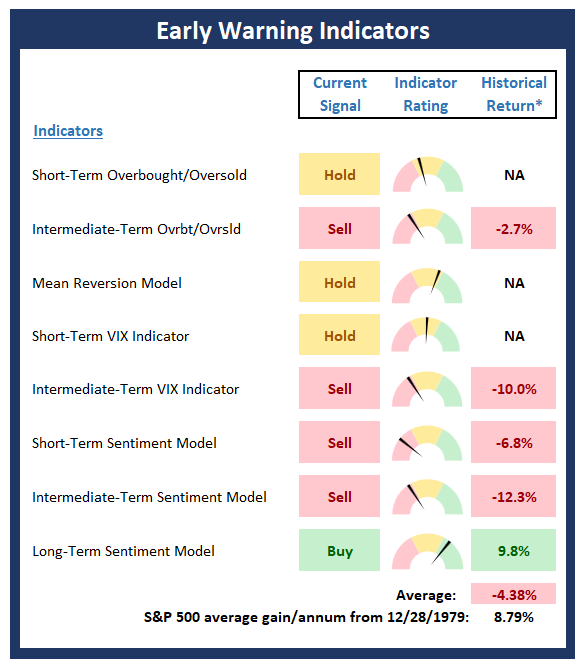
* Source: Ned Davis Research (NDR) as of the date of publication. Historical returns are hypothetical average annual performances calculated by NDR.
Fundamental Factor Indicators
Below is a summary of key external factors that have been known to drive stock prices on a long-term basis.
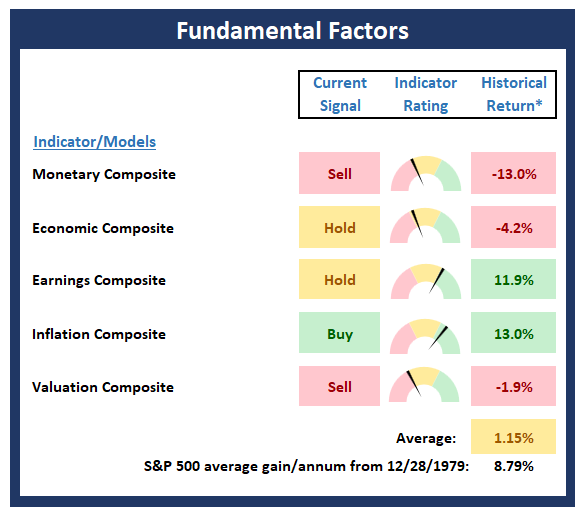
* Source: Ned Davis Research (NDR) as of the date of publication. Historical returns are hypothetical average annual performances calculated by NDR.
More By This Author:
A Matter Of Timing
The Most Important Chart Of The Year
Historical Cycles Disagree With Wall Street


Comments
Log in or sign up to join the conversation.