
Are Equities On The Verge Of Catapulting Higher?
It looked as though markets were on the precipice of breaking down earlier in the trading week, and as headlines suggested that Chinese officials/delegates were inclined to cut their trip short in Washington.
(Click on image to enlarge)
The S&P 500 (SPX) had fallen roughly 2% through Tuesday before counter headlines suggested there was no indication that Chinese officials were amending their scheduled 2-day talks in Washington. Once the confusion was removed from investor concerns, the market quickly recaptured that which it had lost in the first 2 trading days of the week, surging higher to finish the week.
(Click on image to enlarge)
All Things S&P 500
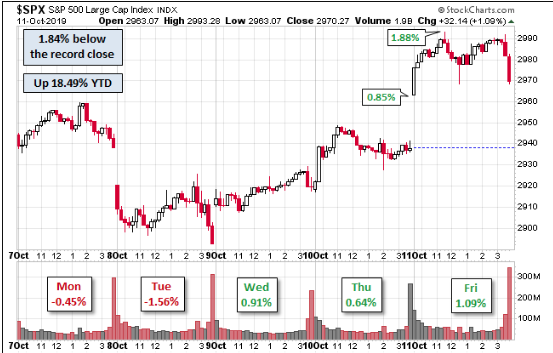
The S&P 500 finished the week up 0.62% from last Friday. The benchmark index is up 18.49% YTD. Finom Group (for whom I am employed) had anticipated some additional volatility in the markets this past week and even some selling pressure leading up to the U.S./China scheduled trade talks. Recall from last week's Research Report we offered the following:
"There may still yet be some market weakness ahead if the support line for the S&P 500 Bullish Percent Index (SPXBPI) is any indication. It has been retreating for the past 2 weeks after recently peaking above 68% recently."
(Click on image to enlarge)
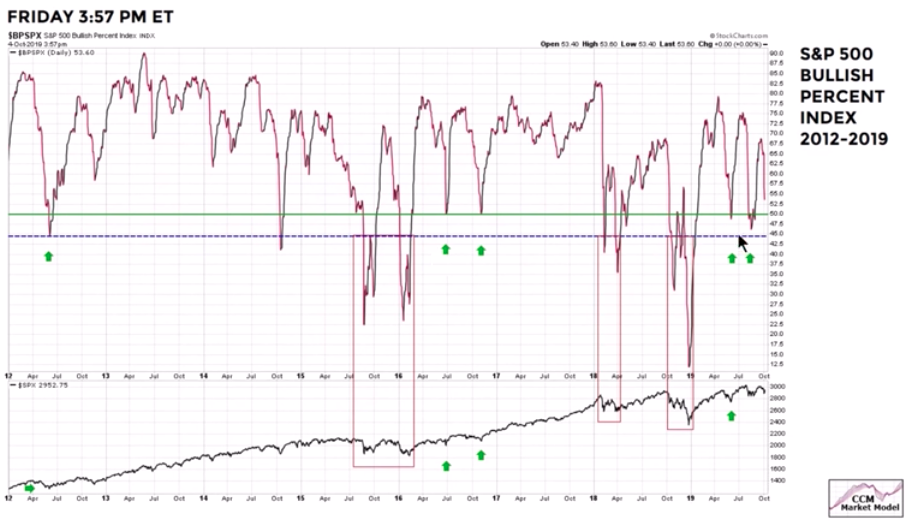
And that is exactly what we got on Monday and Tuesday this past week, additional selling pressure and general market weakness. The SPXBPI did find support. Additionally and from the following chart below, we can see that support for stocks trading above their 200-DMA resides right at the 50% level.
(Click on image to enlarge)
With the number of SPX stocks above 200-MDA finishing the week in an uptrend and at just below 60, I can't help but to recognize what moved markets this past week was quite different than what moved the market 2 weeks ago. Recall 2 weeks ago there was a great deal of economic data that moved markets, but it was soft data. ISM Manufacturing and Non-manufacturing as well as Consumer Confidence readings all came in much lower than expected. Soft data doesn't quite have the impact on markets that hard data does and as such it can cause market turbulence, but much of that turbulence and even selling pressure does little more than technical damage. Sometimes it even results in technical reparation. As such, what we saw from markets two weeks ago was the S&P 500 doing a great deal of gap-filling to the downside, touching key moving average levels of support and bouncing back above major moving average levels. Once again, recall from my last week's Research Report the following notes:
"One of the more important technical achievements for the market this past week was the filling of multiple gaps in the S&P 500 that had been in place since early September. They were all filled at: 2,957-2,939 and 2,911-2,880. Beyond this technical achievement and from revisiting the August consolidation zone…
Most relevant for the bulls, however, was that the S&P 500 managed to rally and close back above the 50-DMA for the week. The bulls did a lot of heavy lifting last week, a lot of heavy lifting. The following chart/s come to us from Ciovacco Capital and identify just how much lifting the bulls had to accomplish last week in order to recapture and close above the 50-DMA:"
(Click on image to enlarge)
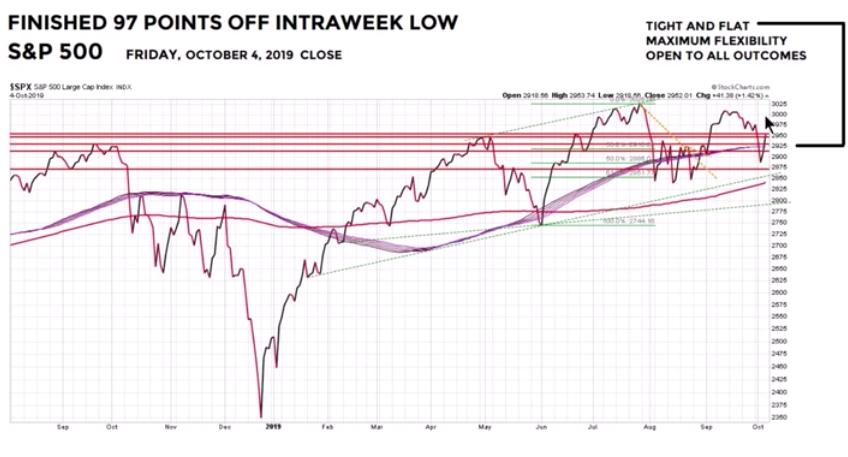
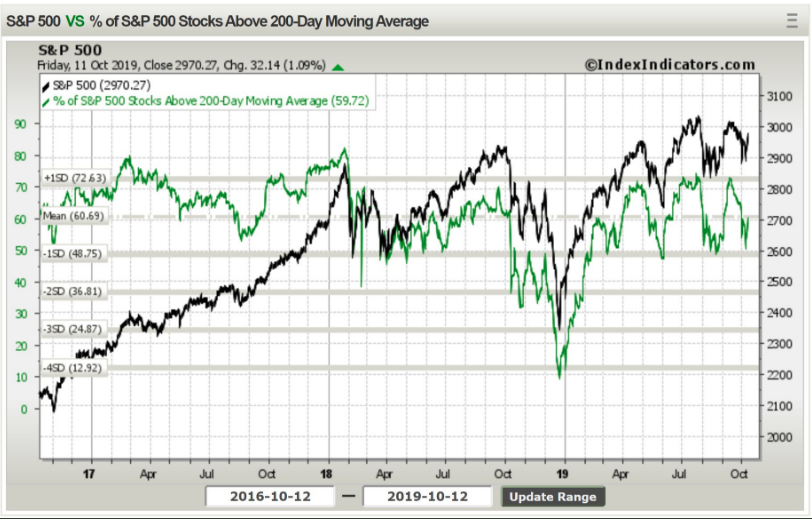
With geopolitical headlines abound this past trading week, it was clear that the market had satisfied its need to fill gaps, test its market symmetry muscles and was moving to price in the potential outcome from the trade talks. With the negative headlines from Monday and Tuesday, the market dropped some 2 percent. Once those negative headlines were found erroneous, the market rallied the following trading days and once again completed a significant intra-week rebound. (charts from Ciovacco Capital)
(Click on image to enlarge)
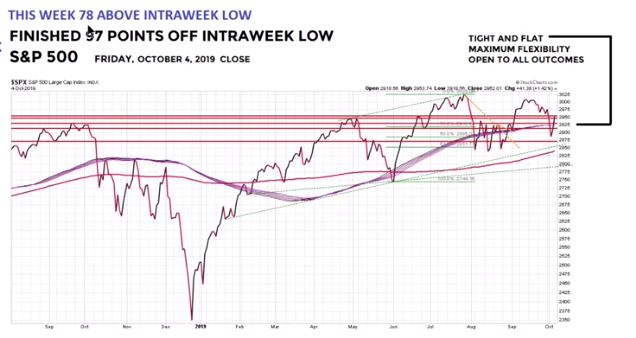
From the intra-week trough, the S&P 500 rallied some 78 points into the closing bell on Friday. This past trading week was all about the trade headlines and anticipating the outcome from trade talks. With market breadth improving we also witnessed a new all-time high for shares of Apple Inc. (AAPL). What's probably more important is that the number of new lows in the stock market also sank last week and shows just how strong market breadth is and has been recently, despite constant equity ETF outflows.
(Click on image to enlarge)
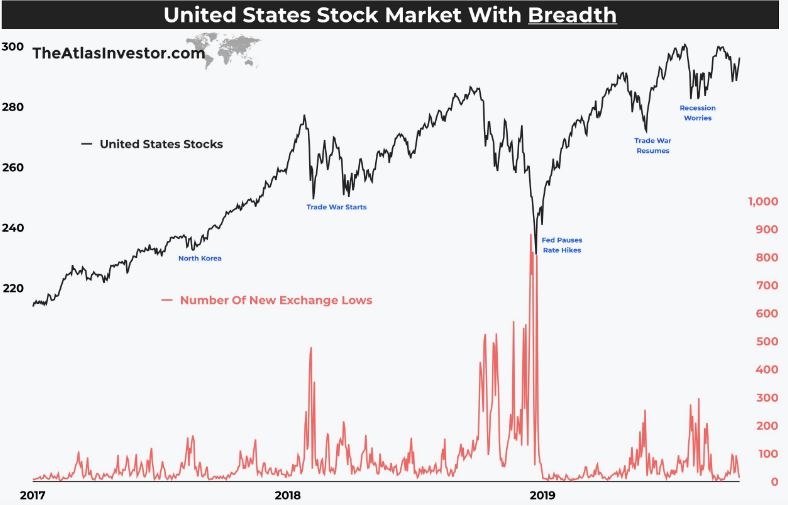
Do you know what happens prior to a stock market peak in most cases and as we look at the W-pattern forming in the S&P 500 presently? Usually, the index masks the underlying weakness, with an increasing number of stocks hitting new lows. While the S&P 500 advances higher, it seems stocks are holding up well, but internally more & more stocks start breaking down & posting 52-week new lows. As shown in the chart above, that simply isn't happening presently. This can change rapidly of course, but that's why we perform due diligence, to examine what might cause a sudden shift in market breadth/internals. So what else? Well, let's take a look at S&P 500 Advancers or ADVSPX!
(Click on image to enlarge)

The chart atop tracks the number of S&P 500 advancing stocks (SPX bottom chart). Recall that the SPXBPI had been declining over the last two weeks, coming into this past trading week. Naturally, we should expect the ADVSPX to weaken/fall in kind with the SPXBPI given the broad index weakness. Okay, we get it; it's not the most impressive looking chart to make any determinations from, so let's explain it with the following video from T.J. Hayes . In the video, T.J. identifies that more often than not, the 25-level provides support for the ADVSPX index. While the 25-level does get breached often, we think of all support levels like soft pillows rather than concrete floors, for which stocks ease into them before bouncing.
The fact is that many of the big moves in the market over the course of 2019 have come from trade headlines and/or trade fallout headline fears. The following charts suggest several different extrapolations for investors to consider with respect to the trade war and how it moves markets from one headline to the next.
- Little to no progress has been made on the trade feud/war.
- Little progress is probable, but the "Trump Put" remains firmly in place.
(Click on image to enlarge)
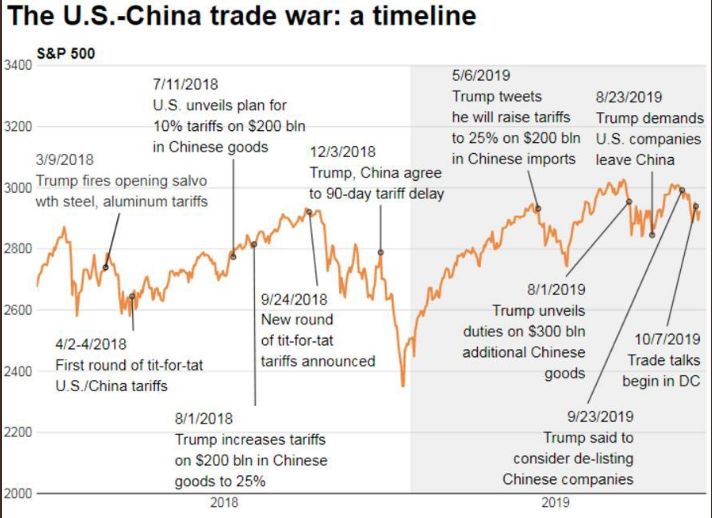
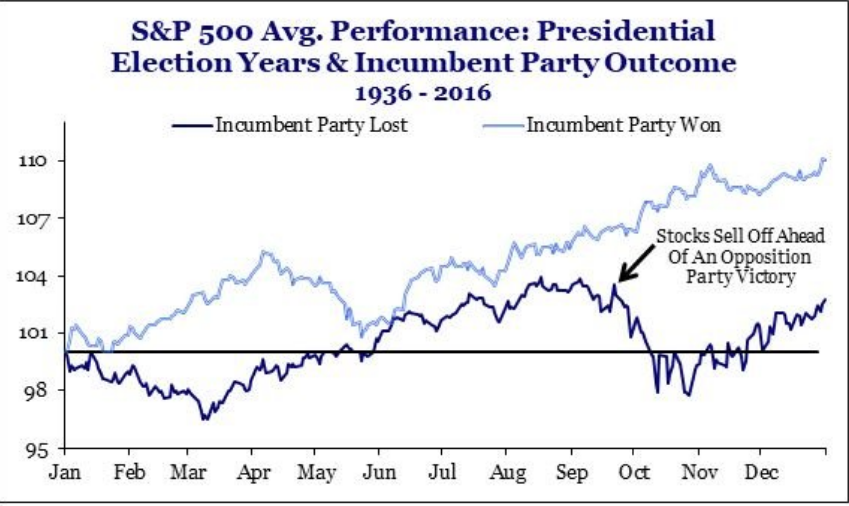
It will be argued both ways, the end result of the latest round of trade talks that is. Make no mistake about it, however, both parties needed a win and desired some level of de-escalation, which was achieved. This is an aspect of the "Trump Put" that has been in play all year long and remains even more relevant today given the ongoing, impeachment inquiry. With that being said, President Trump needs the strength of both the economy and the stock market to improve his probabilities of re-election in 2020. The stock market has been a great indicator of Presidential elections. The incumbent party usually wins if stocks are up in the 90 days leading to election day. If stocks are down, the opposition party wins. This is true for every election since '84 and for 90% of the past 100 years. (Chart from Strategas Research)
(Click on image to enlarge)
As we move beyond trade talks this coming week, although the ongoing trade feud will continue to linger and loom over the economy and investor sentiment to a lesser degree, the technical outlook for the market has markedly improved. Market internals and breadth have both improved while we also witnessed a plunge in the equity put/call ratio on Friday.
(Click on image to enlarge)
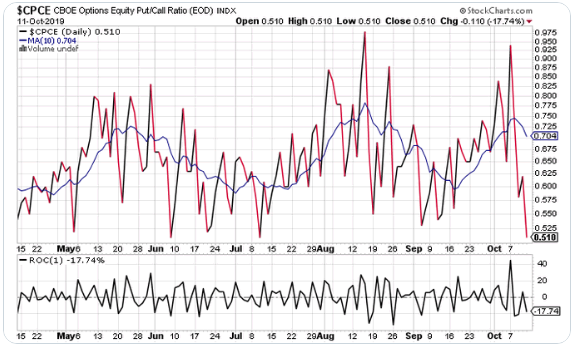
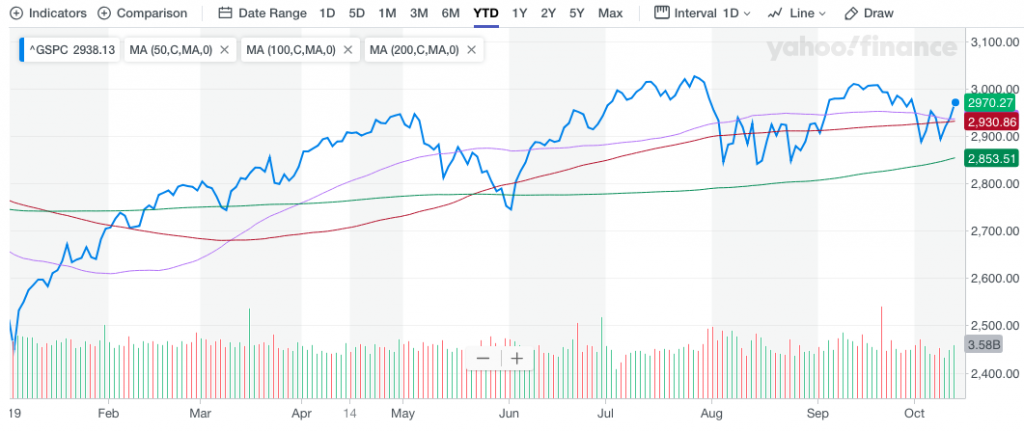
The Equity put/call ratio plunged to 51% (lowest since 7/10). It's clear that investors and traders scrambled to buy the rally, at least before they realized it was somewhat of a "skinny deal". Nonetheless, where the market finished the week proved once again to be with positive momentum and above key moving averages. The S&P 500 finished above the 50-DMA for the second week in a row and with all 3 major moving averages curling up.
(Click on image to enlarge)
The W-pattern formation from late September through early October is almost the perfect set-up for the seasonal lift-off for the benchmark index. Next week alone is setting up as one of the better weeks of the year both in terms of returns and return probabilities. The following graphic below identifies a seasonal pattern that commences in mid-October and lasts through April. (Bespoke Investment Group)
(Click on image to enlarge)
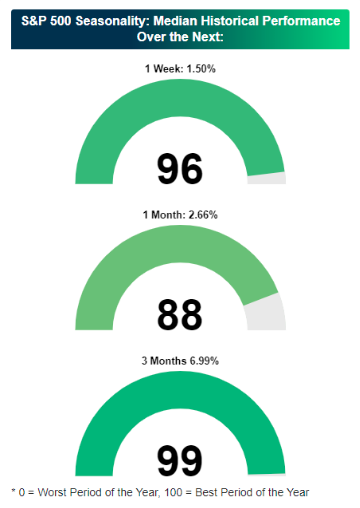
Based on history, it would appear as though the probability for the S&P 500 to have another positive week is remarkably strong. And don't forget the seasonal patterns that I recently outlined from this week's State of the Market video. While the "Sell in May and go away" period is coming to an end, the "Buy the October Dip" is in play:
- Historically it pays to buy the dip in October in preparation for “The Best 6 Months”. Here is another chart from the Almanac showing the seasonal pattern for all years since 1901 and then overlaid with just the Pre-Election Years.
(Click on image to enlarge)
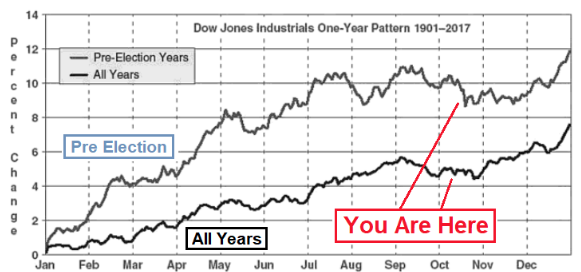
- Well according to the Stock Traders Almanac, October has gotten much better over the past 21 years. This is a month that is known for crashes and stock underperformance. But look more recently. It’s actually the exact opposite now. October is a time to buy, not sell:
For the coming week and with implied volatility falling roughly 9% last week, the weekly expected move has fallen from $53/points to $51/points. It's not a lot, but then again the S&P 500 was up only .6% for the week and the VIX only fell roughly 9 percent. Keep in mind that this coming week also marks VIX Futures expiration on Wednesday morning at 7:00 a.m. EST.
Weekly Economic Data
It was a light economic data week this past week, but that will only provide investors, analysts and economists with a short-lived reprieve as the data kicks into high gear once again this coming week. Nonetheless, we come into another heavily loaded data calendar at a critical juncture; investor sentiment is in the doghouse and increasingly bearish and economic policy uncertainty remains elevated.
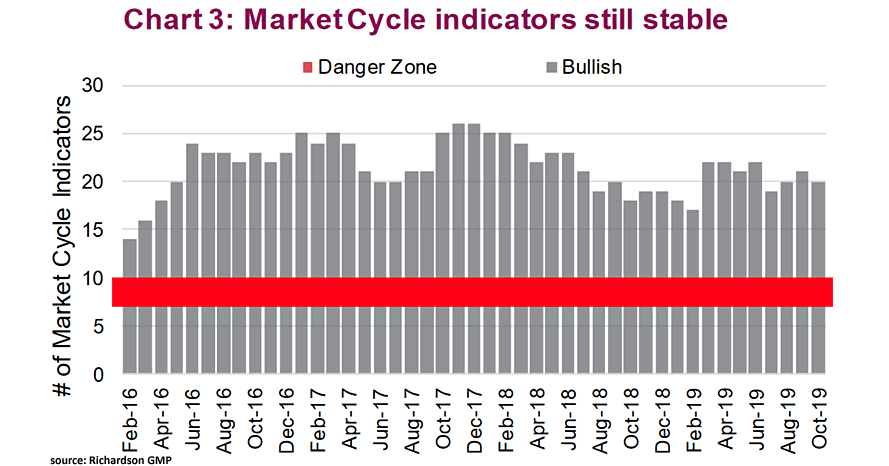
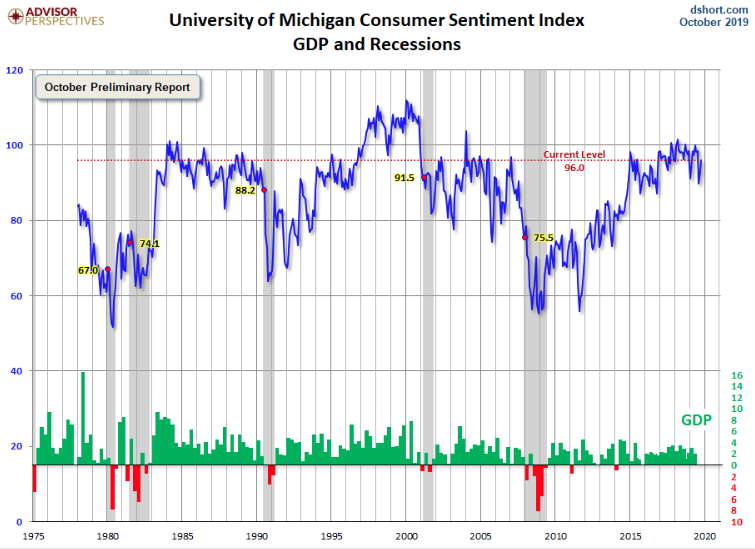
The current economic cycle is the longest expansion cycle in history and is naturally bringing about a fearful end to the cycle simply based on duration if nothing else. According to the following chart, the current business cycle’s risk of a bear market is low when the number of market cycle indicators is greater than 10.
(Click on image to enlarge)
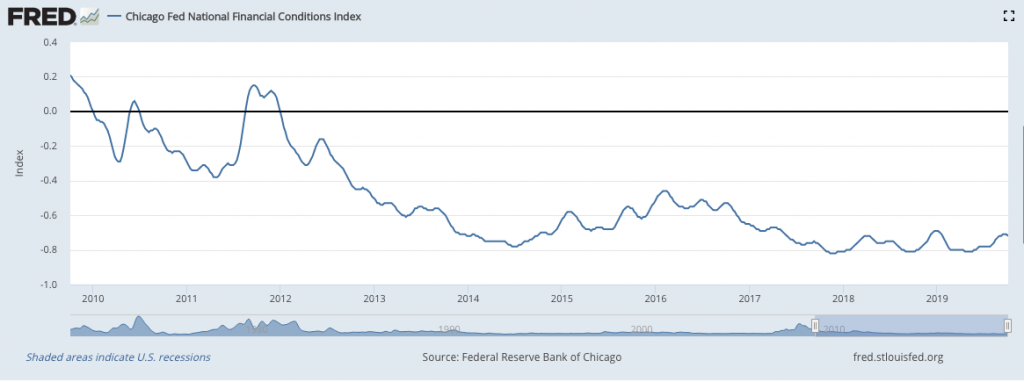
While we can review every aspect, turn over every unturned rock and prepare for a recession, present conditions don't scream a recession is imminent. Financial conditions remain loose and will likely loosen further as the Fed embarks on expanding its balance sheet by some $60bn a month, as recently announced.
(Click on image to enlarge)
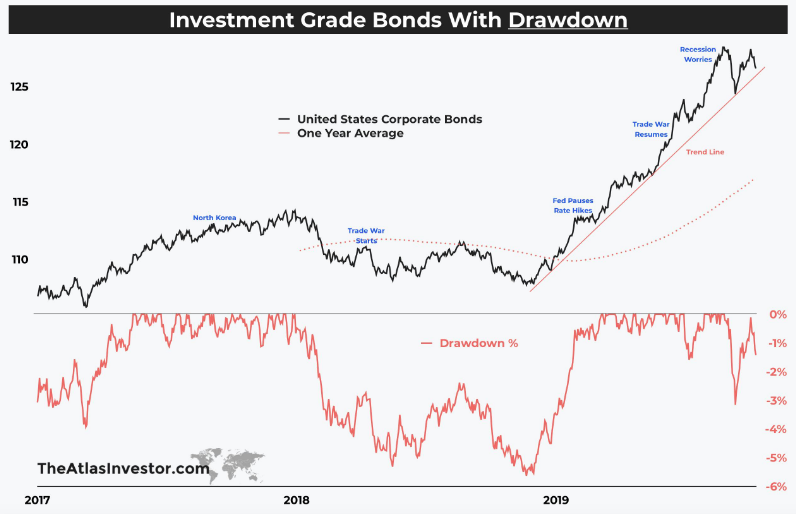
Furthermore, when I look at the corporate bond market,I would have been more concerned about a recession during 2018 than today. Stocks were declining in 2018, bonds were very soft & credit spreads were rising. The following chart identifies the corporate bond market performance over the last few years.
(Click on image to enlarge)
I respect and look at all the economic data points offered by the various government and private organizations, looking for potential pitfalls that can plunge the economy, but at present, we have yet to find them. Additionally, I don't deny the weakness in certain sectors of the economy. In 2018, I identified and dealt with the housing sector weakness all year long. In 2019, it would appear as the housing sector has come into favor, with many of the sector data points showing YoY and MoM growth, while the manufacturing sector is expressing its own weakness in 2019. Much of the strength that now resounds in the housing sector is a byproduct of lower rates, rising wages, and low employment levels. Much of the weakness in manufacturing is a byproduct of lower business investment, trade feuds and generally high comparisons from the previous year that benefited from tax reform stimulus. In fact, Goldman Sachs was out with a note on Friday suggesting that rate-of-change from stimulus may be overstating some of the economic weakness in 2019 within the manufacturing sector.
- GOLDMAN: U.S. growth was boosted after 2018 stimulus, and the waning boost this year "may be overstating the downward trend of growth in the underlying economy. Our findings argue for putting more weight on indicators of today’s growth rate, which are not sending alarming signals."
With a focus on the manufacturing sector weakness in the back half of 2019, investors will get a fresh batch of manufacturing data this coming week. Before I get to the pending data, let's take a look at one of the more anticipated pieces of economic data from the prior week. No, it wasn't PPI or CPI, as both weren't expected to move markets or show any concerning signs of inflation. Let's face it, inflation went out with the 1980s. Nonetheless, let's take a peek at Consumer prices just to maintain a modicum of thoroughness in our reporting.
The consumer-price index was flat in September, the government said Thursday, marking the smallest change since January. Economists polled by MarketWatch had forecast a 0.1% advance. The increase in the cost of living over the past 12 months was also unchanged at 1.7 percent.
(Click on image to enlarge)
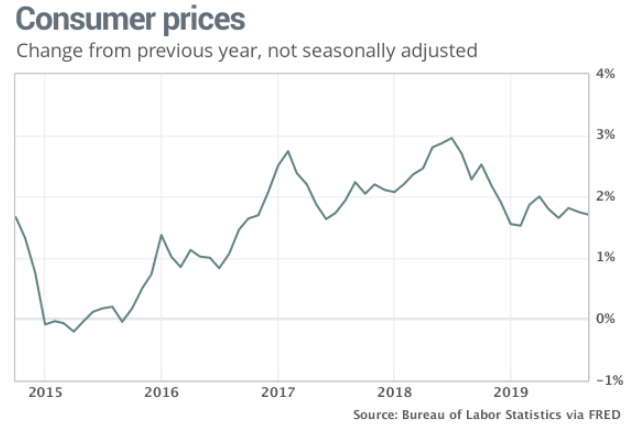
The low rate of inflation, reflected in the CPI and other price barometers, may allow the Fed more leeway to trim rates if growth in the economy continues to slow. Wall Street puts a high chance the central bank will reduce rates again at the end of the month.
(Click on image to enlarge)
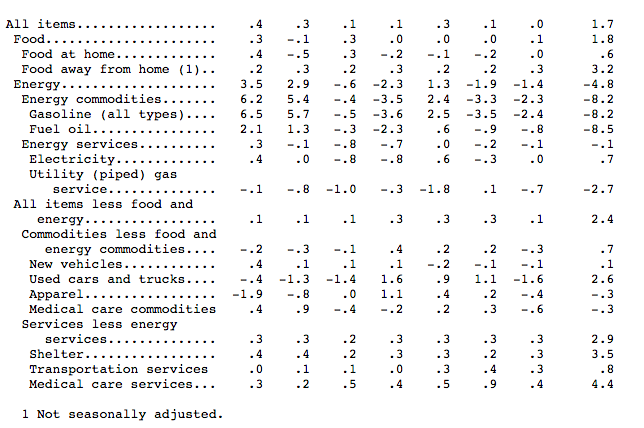
If it weren't for transportation, medical care services, and shelter, the economy would likely be in a state of persistent deflation folks. And do check out the Apparel category from the latest CPI data, which identifies yet another annual deflationary period for the category. With that in mind, we examine the latest notes on this very subject from Morgan Stanley. The notes are rather eye-opening as it pertains to some of the major department store retailers.
- For 20 years falling apparel prices in developed markets were offset by consumers buying ever-larger quantities.
- But volumes now seem to have peaked and prices are likely to keep falling, so clothing markets would appear to be going into structural decline. Short H&M, Inditex, GAP, Macy's, Kohl's, American Eagle and Abercrombie & Fitch.
- “The world's leading dozen listed apparel retailers have, on average, seen earnings downgrades of almost 40% since the beginning of 2016. Online channel shift is clearly unhelpful, but it doesn’t fully explain the malaise.
- We think there is another powerful headwind developing; the apparel markets in developed countries beginning to go into decline. The move to sourcing from Asia, combined with the rise of 'value' retailers, has seen clothing prices fall significantly over the last two decades.
- For many years consumers responded to this by buying apparel in ever-larger volumes: Kantar data suggests consumers in the UK are now buying more than 50 items of clothing per person per annum and in the US the figure may be even higher (c65 on some estimates).
- There is evidence emerging, however, that volumes are now plateauing. It's not entirely clear why, but we suspect it's primarily because consumers are now buying clothing in such large quantities that they get very little marginal 'utility' from any additional items they purchase.”
(Click on image to enlarge)
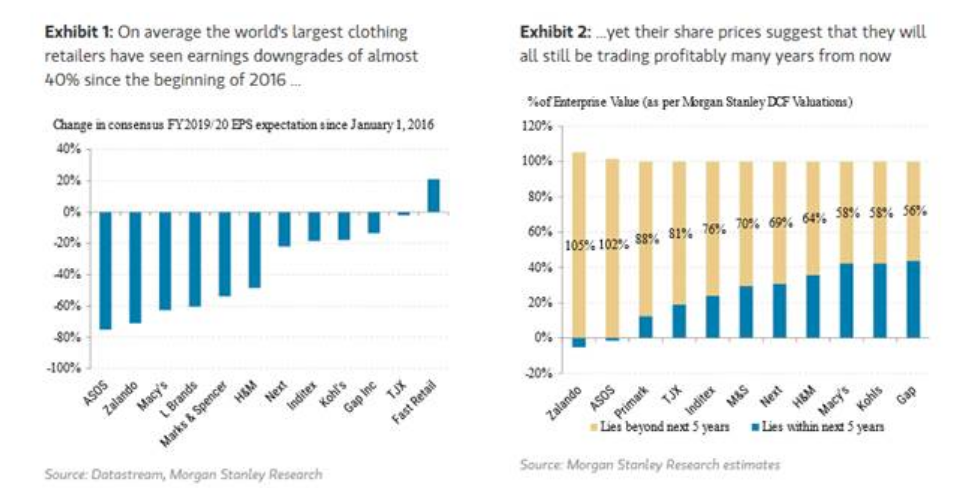
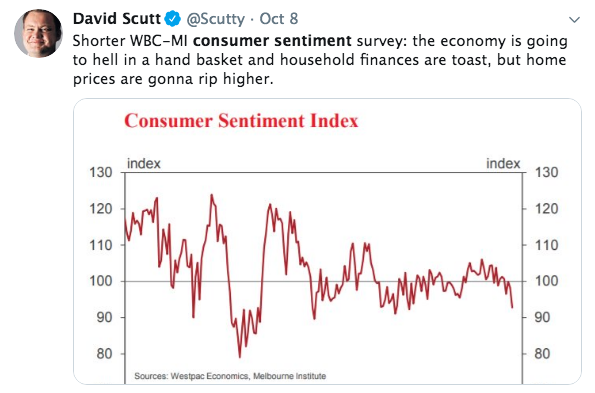
With apparel in focus, we look forward to this coming week's release of the September monthly retail sales. My expectation is to see some MoM cooling of retail sales, but the YoY trend should remain healthy. Ahead of the data, we saw yet another ramp in consumer sentiment.
The consumer sentiment survey rose to a three-month high of 96 this month from 93.2 in September, the University of Michigan said Friday in a preliminary estimate. Economists surveyed by MarketWatch had forecast a reading of 92.5.
(Click on image to enlarge)
A gauge that measures what consumers think about their own financial situation and the current health of the economy rose to 113.4 from 108.5, marking the highest level since the end of 2018.
The preliminary University of Michigan Consumer Sentiment data increased for the second month in a row. Nonetheless, ahead of the data, many market participants were painting a gloom and doom scenario for consumer sentiment and as it relates to the economy.
(Click on image to enlarge)
(Click on image to enlarge)
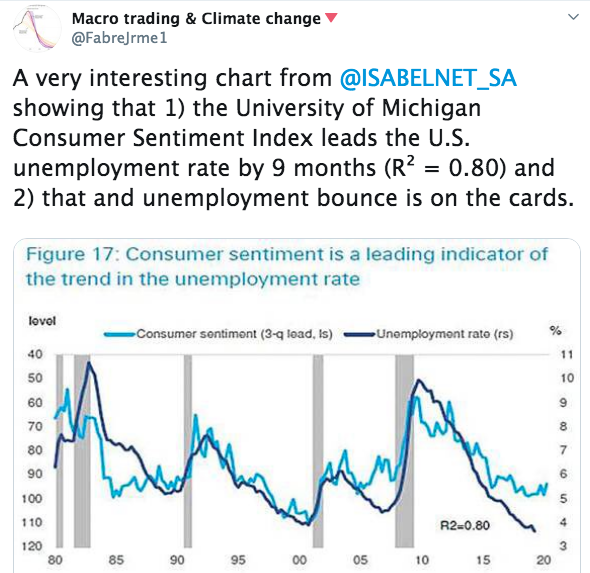
Everyone is just so pessimistic nowadays! Social media is a breeding ground for such commentary and pervasive bearish sentiment. Furthermore, these 2 tweets came the day before the release of the Consumer Sentiment reading and on the same day that Initial Jobless Claims showed a significant drop once again.
(Click on image to enlarge)
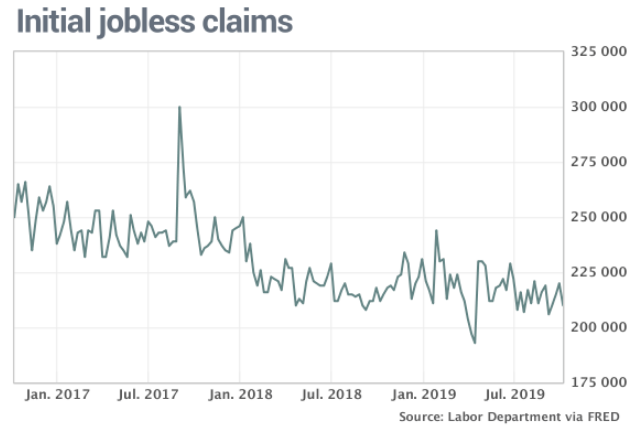
Initial jobless claims, a rough way to measure layoffs, declined by 10,000 to 210,000 in the seven days ended Oct. 5, the government said Thursday. Claims remained elevated in Ohio and Michigan, two states with large auto industries. Some 250,000 workers have been on strike for nearly a month and the prolonged standoff has forced parts suppliers to idle workers as well. The more stable monthly average of new claims, meanwhile, edged up by 1,000 to 213,750 nationwide. The four-week average usually gives a more accurate read into labor-market conditions than the more volatile weekly number.
Ultimately and as we look forward, the coming week's economic data releases will highlight the consumer, manufacturing, and housing once again.
(Click on image to enlarge)
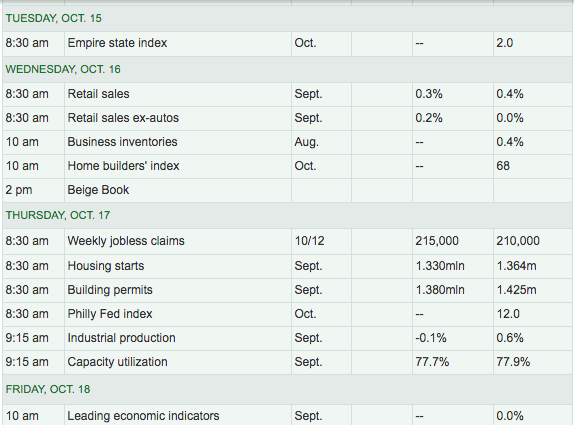
In honor of Columbus Day, no data will be released on Monday and the bond market will also be closed. There remains just a few Q3 data points to be revealed before the tally for Q3 GDP forecasts are complete, but as of last week, GDP forecasts have come down once again.
The economy continues to express a trend-growth GDP of 1.7-2.3% and without signs of an imminent recession, despite what ails the permabear purview. While we can't deny that the yield curve inversion is one of the signals that "starts the recession clock", we are still a ways off from even that signal developing recessionary economic conditions. Furthermore, we usually see significant gains in the S&P 500 leading up to the actual recession. Recall Canaccord Genuity's Tony Dwyer offered the following notes regarding recessions and the S&P 500:
Canaccord Genuity chief market strategist Tony Dwyer weighed in on the yield curve inversion subject on Monday, issuing the following chart:
(Click on image to enlarge)
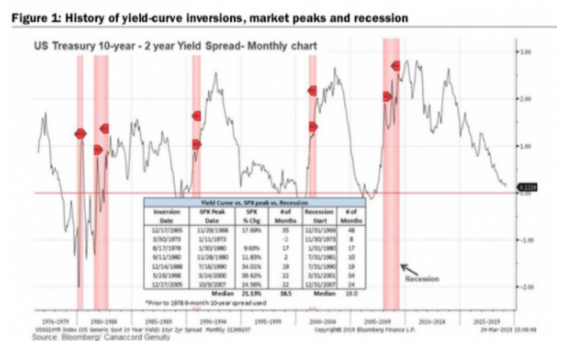
"Dwyer went further to say, “Even if the YC (yield curve) inverts tomorrow, over the past seven economic cycles, the median SPX gain from the initial inversion to the cycle peak is 21%, with a recession a median 19 months after the initial inversion.”
With Tony Dwyer's historic data in-hand, the reality is recessions aren't necessarily predictable. We have only had 11 recessions since World War II (and just three in the past 37 years). That’s a very small sample size. The economy has evolved in significant ways over time. So, past experience may not tell us much.
There are few signs that the overall economy is currently in a recession. The household sector fundamentals (job gains and wage growth) have remained strong, and consumer spending (70% of GDP) should provide support for overall economic growth in the near term. While I don’t see the kind of excesses that would lead to a more pronounced economic downturn, the tools for fighting a recession are likely to be constrained in a future downturn.
Fund Flows
Nothing terribly new in the fund flow universe according to Lipper Weekly FundFlow data. For the third week in a row, equity ETFs witnessed net outflows, handing back $3.0 billion for the most recent fund-flows week. Authorized participants (APs) were net redeemers of domestic equity ETFs (-$3.3 billion), also for the third week running. Meanwhile, non-domestic equity ETFs witnessed net inflows for the second consecutive week—however, they took in only $261 million this past week. iShares Core S&P 500 ETF (IVV, +$1.1 billion) and Consumer Staples Select Sector SPDR ETF (XLP, +$775 million) attracted the largest amounts of net new money of all individual equity ETFs. At the other end of the spectrum, SPDR S&P 500 ETF (SPY, -$4.9 billion) experienced the largest individual net redemptions, and iShares QQQ Trust 1 ETF (QQQ, -$974 million) suffered the second largest net redemptions of the week.
(Click on image to enlarge)
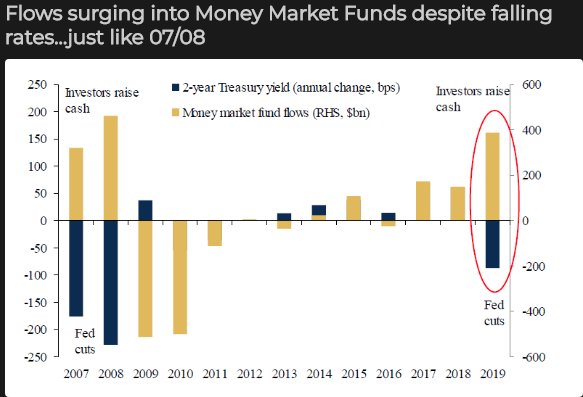
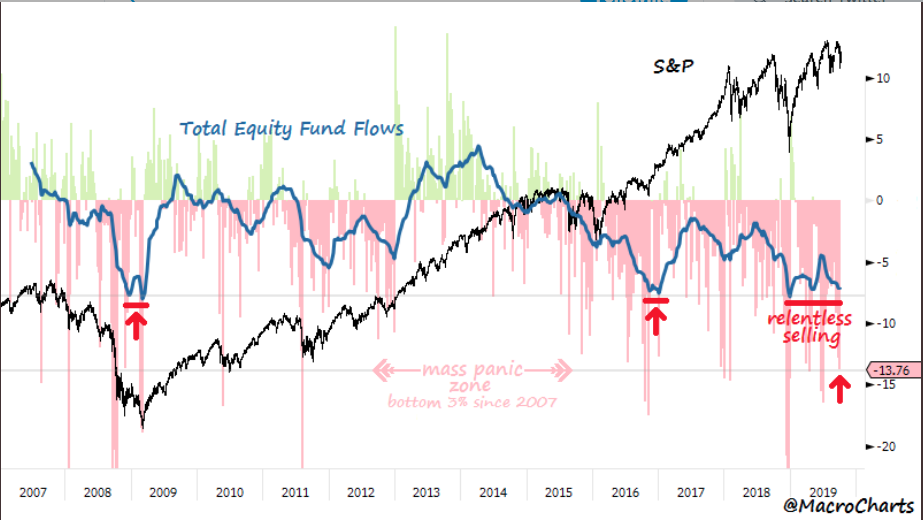
For a multitude of reasons that we've outlined throughout 2019, bond inflows continue alongside money market fund flows. Money market flows as a percentage of AUM are basically at Great Financial Crisis panic levels. Fund flows into money markets all by themselves are eerily pointing toward a recession as well.
(Click on image to enlarge)
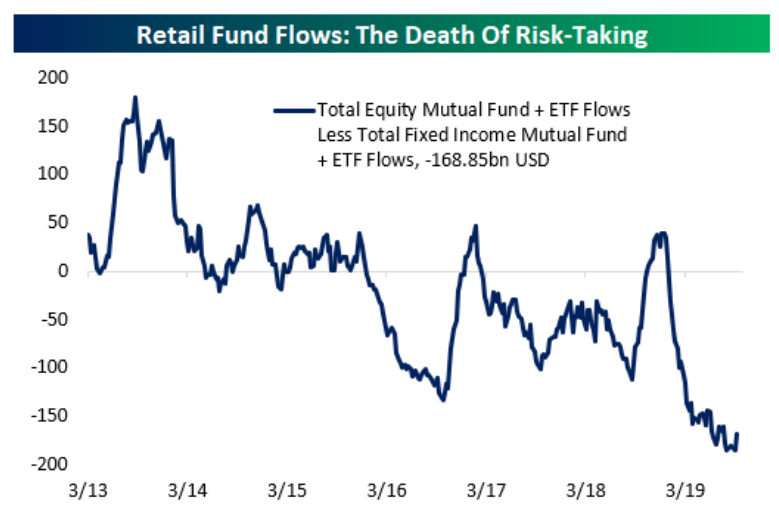
As we saw in the latest TD-Ameritrade Investor Movement Index (IMX), even retail traders have been net sellers of equities. According to the latest data from Bespoke Investment Group, the spread between equity fund flows & fixed income fund flows has reached a net reading of -$166B over the last 3 months, among the largest net flow out of equities & into bonds since the data starts.
(Click on image to enlarge)
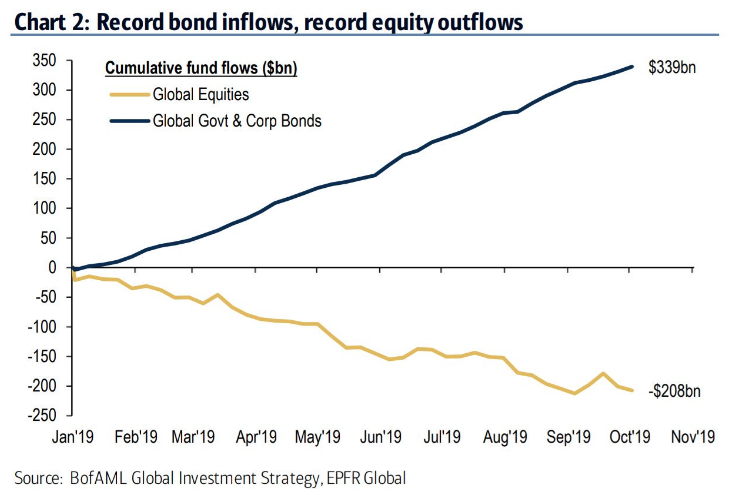
And when we look at the latest BofAML fund flow data, the picture doesn't get any more favorable for equities. Cumulative fund flows YTD: $339b into bond funds and $208b out of equity funds. Both on track for largest inflows/outflows on record.
(Click on image to enlarge)
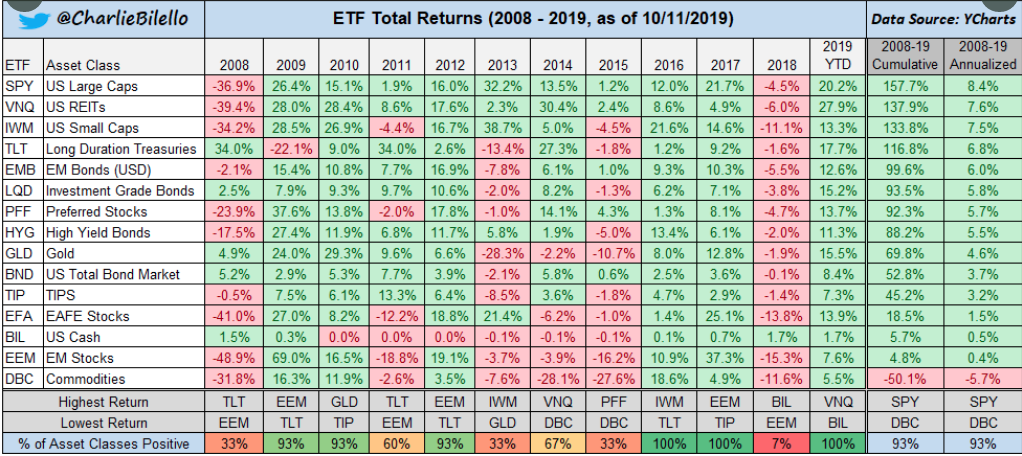
Despite equity fund outflows in 2019, markets and/or asset classes are maintaining much of their YTD gains. In 2018, 14 out of 15 major asset classes finished lower, with cash outperforming everything. This year, all 15 asset classes are positive, with cash underperforming everything.
(Click on image to enlarge)
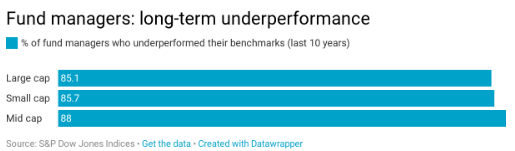
Moreover, speaking of underperformance... It's been yet another year of fund manager underperformance. This week, S&P Dow Jones Indices released its annual report on how actively managed funds performed against their benchmarks. The conclusion is that active managers continue to show dismal performance against their passive benchmarks. For the ninth consecutive year, the majority (64.49%) of large-cap funds lagged the S&P 500 last year.
(Click on image to enlarge)
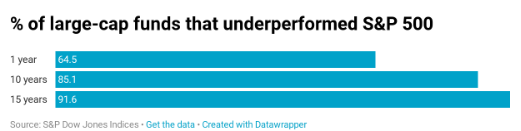
This is not a one-year phenomenon. S&P has been doing this study for 16 years, and the long-term results only strengthen the claims for index investing. Indeed, while a fund manager may outperform for a year or two, the outperformance does not persist. After 10 years, 85% of large-cap funds underperformed the S&P 500, and after 15 years, nearly 92% are trailing the index.
(Click on image to enlarge)
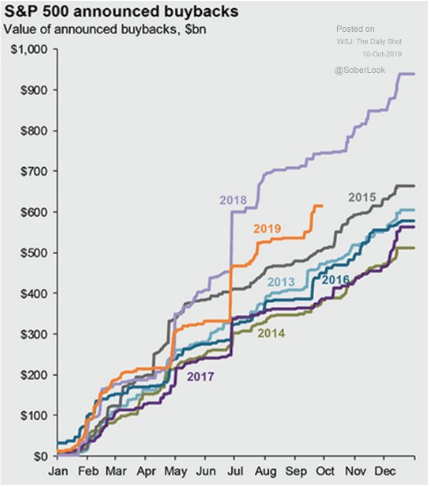
While we can't fight the trend in the data, we can rationalize why the S&P 500 continues to trek higher, even with flat to slightly lower YoY EPS growth. Corporates are still more than making up for that which is fleeing equity ETFs. Buybacks are on track to reach $750bn in 2019, down from nearly $1tn in 2018, but more than plugging the whole in the demand equation for equities.
(Click on image to enlarge)
Earnings Outlook
Earnings seasons is finally upon us folks! Analysts estimate companies in the S&P 500 will report a -4.1% drop in profits from the year-earlier period, according to FactSet. That would mark the third straight quarter of contraction and the longest such streak since 2016. But do keep in mind the current NON-GAAP EPS decline is extremely light when compared to that of the 2015-2016 period.
(Click on image to enlarge)

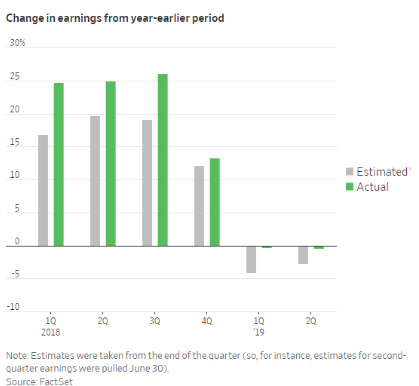
Analysts tend to lower their expectations for companies’ quarterly results in the months heading into earnings season. As a result, their estimates tend to fall significantly short of what companies actually report. During the last round of earnings reports, 75% of companies in the S&P 500 beat analysts’ earnings estimates, and the S&P 500 ultimately reported a -0.1% drop in earnings, far better than the June 30 estimates of a -2.7% decline. Going back five years, companies’ earnings have exceeded estimates by an average of 4.9 percentage points, according to FactSet. Now if we apply that same math to the third quarter earnings season, there is reason to believe that corporate profits will grow ever so slightly.
(Click on image to enlarge)
While corporations are dealing with prolonged trade uncertainty, a slowing economy and a stronger dollar, history also shows analysts have consistently underestimated companies' actual earnings growth. With that being said, Credit Suisse is forecasting a far better result from the Q3 earnings season than is being forecasted by either FactSet or Refinitiv. The Credit Suisse prediction is that S&P 500 companies will actually post earnings growth of 1.5% in 3Q, well above current estimates on FactSet of -4.1 percent.
In speaking of the Q3 EPS forecast from Refinitiv, their latest forecast has worsened from the prior week. In the previous week, Refinitiv had been forecasting Q3 EPS to decline by -2.7 percent. Below is their latest forecast:
Aggregate Estimates and Revisions
- Third quarter earnings are expected to decrease 3.2% from 18Q3. Excluding the energy sector, the earnings growth estimate is -1.0%.
- Of the 23 companies in the S&P 500 that have reported earnings to date for 19Q3, 91.3% have reported earnings above analyst expectations. This compares to a long-term average of 65% and prior four quarter average of 74%.
- 19Q3 revenue is expected to increase 3.5% from 18Q3. Excluding the energy sector, the growth estimate is 4.6%.
- 56.5% of companies have reported 19Q3 revenue above analyst expectations. This compares to a long-term average of 60% and an average over the past four quarters of 59%.
The good news is that nearly all companies that have reported to-date have beaten analysts' estimates. The bad news is that the beats haven't been enough to boost forecasts, but rather found them falling further week-over-week. And that will bring us to another point that is often raised by permabears: "With earnings slightly negative on the year, the market should be much lower than where it is!"
I urge investors to firstly recall the earnings recession from the 2015-2016 period noted above and compare it to the present earnings recession. Secondly, I urge investors to recognize that we are currently in an easing cycle, with ever-lower interest rates/yields on the horizon. The equity risk premium under such a low rate regime remains quite high and demands of many institutional investors and pension funds to seek out and find higher-yielding investment vehicles. That usually means they have to go out on the risk curve and allocate capital to equities in various degrees. Such low rate/yield environments whereby YoY EPS is flat and central banks are cutting rates usually result in PE expansion. In fact, almost all the S&P 500 gains in 2019 is a result of PE expansion.
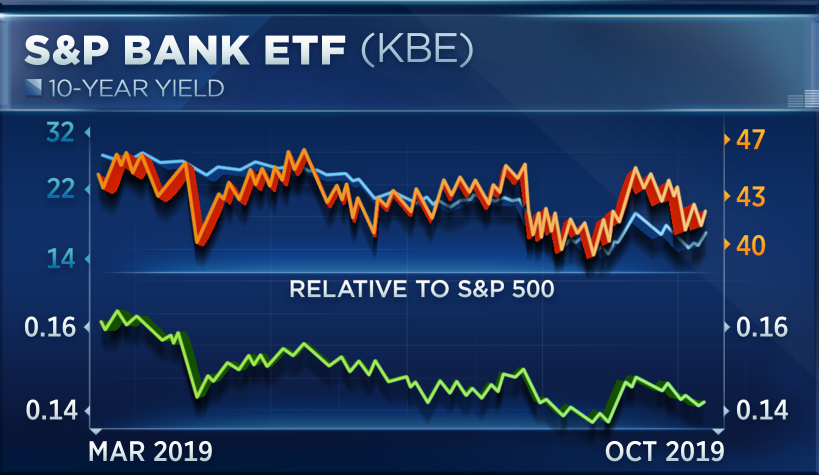
Heading into the financial sector reporting season, certain charts are suggesting the sector will show significant gains. Todd Gordon, a longtime trader and founder of TradingAnalysis.com, who took a technical look at the SPDR S&P Bank ETF (KBE) and the SPDR S&P Regional Banking ETF (KRE) recently.
For much of 2019, bonds have climbed while yields sank, hurting “the earnings potential for those financials” and accelerating their underperformance relative to the S&P 500, Gordon said.
“But we’ve seen hope. We’ve seen a pretty strong move down in bonds [and] up in yields just recently, and you’re starting to see a little bit of outperformance of the KBE relative to the S&P,” tracked by the green line on the following chart:
(Click on image to enlarge)
“We’ll see how earnings come out. We obviously have a lot of wood to chop above us.”
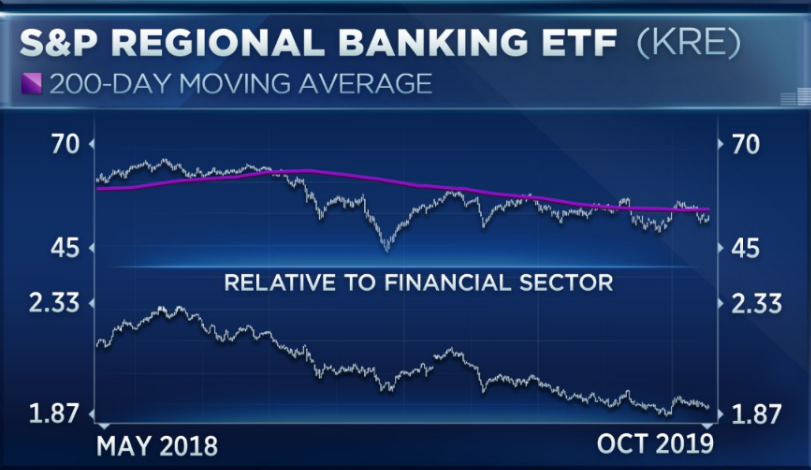
The regional banks were also showing signs of strength, though, Gordon said. He noted that the KRE has been in a consolidation range for the last eight months or so, doing “absolutely nothing,” with its 200-day moving average as the ceiling.
(Click on image to enlarge)
Gordon recommended one name to capitalize on a potential move higher in yields and strong earnings: PNC Financial, a member of the regional and broad bank ETFs. He said it’s “showing a lot of relative strength relative to both regionals and the big banks,” with some resistance around the $170 level, which it nearly reached in 2018.
Not everyone is on-board with Gordon's trade thesis and it would seem a tough pitch at this stage of the economic cycle and with net interest income hard to come by for big money center banks and regional banks alike. Gina Sanchez, founder and CEO of Chantico Global said that she was avoiding the group altogether.
“It’s really hard to get behind this story. Banks are going into this earnings season with ... negative estimate revisions, downgrades, and the market is continuing to slow, so fee income is continuing to get harder and harder to come by. And with rates having gone down as much as they have, it’s just a tough ride for banks right now."
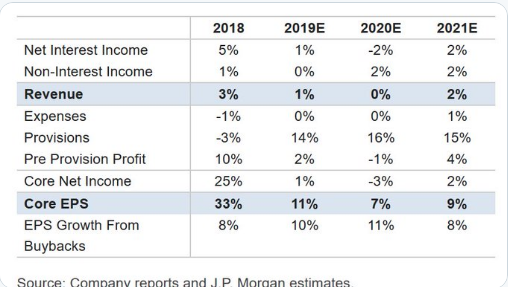
Here's the problem with Gina Sanchez' sour grapes, so to speak: net interest margin rates are not where the financials are going to gather their EPS growth from. According to J.P. Morgan Chase, the financial sector EPS growth is going to come from what else, buybacks. (See chart below)
(Click on image to enlarge)
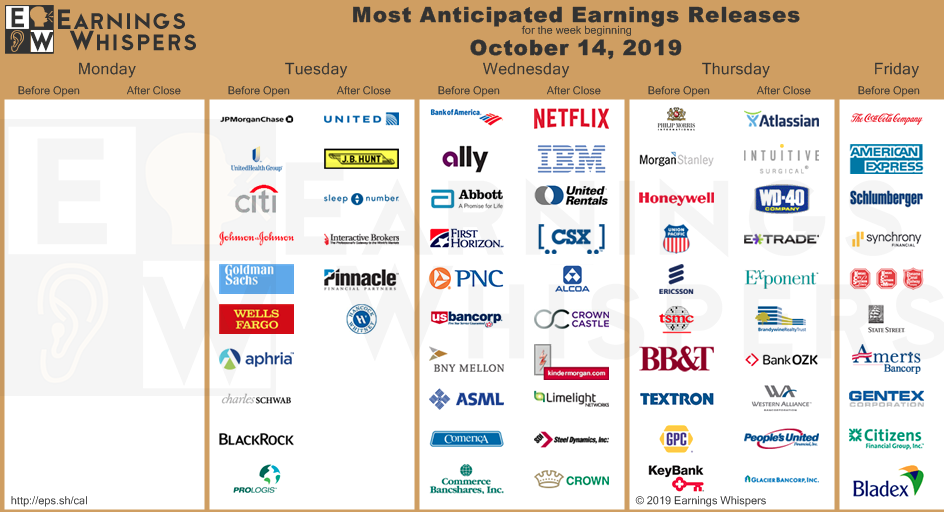
First out of the gate this week for the major banks are J.P.Morgan, Citigroup, Wells Fargo, BlackRock and Goldman Sachs reporting Tuesday. But by the end of the week, a smattering of industrial, tech, transportation, and consumer names will have reported, including Alcoa and Honeywell. Netflix and IBM report Wednesday, and consumer giant Coca-Cola reports Friday. United Airlines reports Tuesday, and CSX reports Wednesday.
(Click on image to enlarge)
Although Credit Suisse believes Q3 EPS will grow 1.5% YoY, Patrick Palfrey, senior equity strategist at Credit Suisse is not of the same opinion. He projects earnings overall to decline by 4.2%, and he does not expect the stock market to make much headway during the earnings season.
“I think we’re moving sideways. The real backstop is the environment, while under pressure, it is nonrecessionary, and that will ultimately prevent the market from materially selling off."

Paul Hickey, co-founder of Bespoke said in the past two quarters, stocks did well at the start of the reporting season, but they were then derailed by trade developments in the latter part of the earnings period.
Hickey makes a good point about prior earnings seasons being disrupted by trade headlines. For this reason alone and if not any other, we would propose the current de-escalation of the trade feud as a net positive through earnings season. Having said that, Brexit headlines may prove an outlier, as we look at the trade war tracker from Ethan Harris of Bank of America Merrill Lynch.
(Click on image to enlarge)
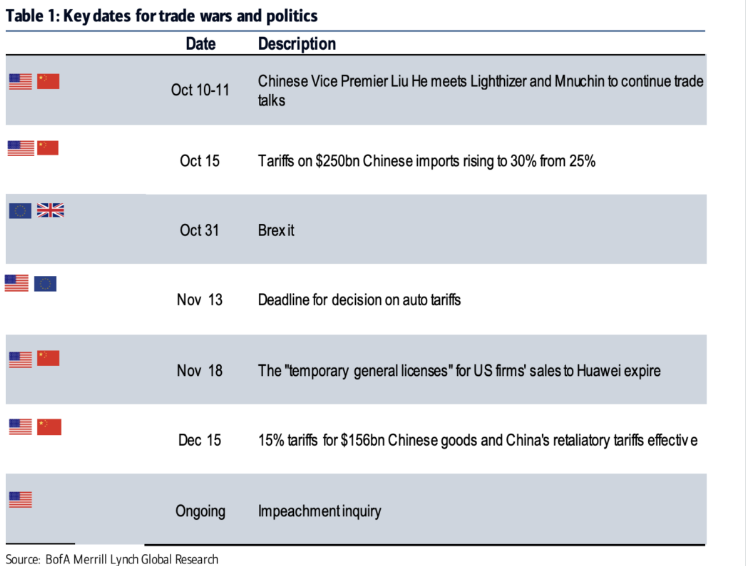
Moreover, and as shown in the trade tracker timeline tracker above, earning's season will still be ongoing during the period whereby the USTR will be deciding on EU auto tariffs. Nonetheless, if we only focus on the earnings results, Paul Hickey rounds out his focus on earnings with the following commentary:
“Expectations seem pretty low. We’ve had analysts’ downward revisions remain elevated, as they’ve been heading into prior warning seasons. But we haven’t necessarily seen the number of warnings from companies rising. It could be a positive divergence that analysts are lowering earnings estimates at a higher-than-average rate, but companies aren’t warning at a higher-than-average rate.”
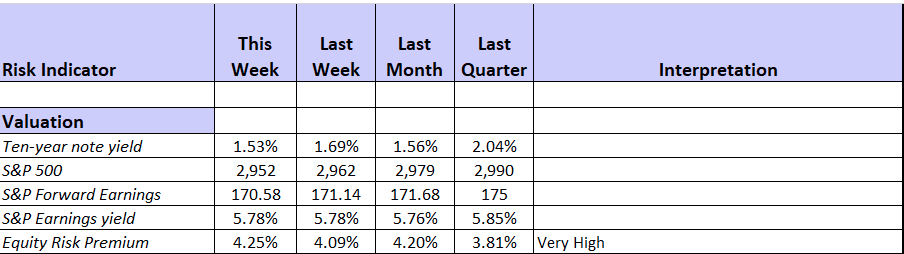
I'm of the belief that earnings season will once again surprise to the upside and possibly prove flat EPS growth YoY. As such, we can rationalize the search for yield in a low-rate, low inflation environment may find the S&P 500 challenging and/or breaking the 3,000 once again at some point during the Q3 earnings season. As shown below, the equity risk premium still favors equities.
(Click on image to enlarge)
Investor Takeaways
One major concern/headwind for the market has been temporarily removed in the way of the U.S./China trade feud.
"The U.S. and China reached a partial agreement Friday that would broker a truce in the trade war and lay the groundwork for a broader deal that Presidents Donald Trump and Xi Jinping could sign later this year.
As part of the deal, China would agree to some agricultural concessions and the U.S. would provide some tariff relief. The deal under discussion, which is subject to Trump’s approval, would suspend a planned tariff increase for Oct. 15. It also may delay — or call off — levies scheduled to take effect in mid-December.”
Reuters reports U.S. Outlines 'Phase 1' Trade Deal With China, Suspends October Tariff Hike. Friday’s announcement did not include many details. President Trump also acknowledged the agreement could fall apart during that period, though he expressed confidence that it would not.
President Trump, who is eager to show farmers in political swing states that he has their backs, lauded China for agreeing to buy as much as $50 billion in agricultural products. But he left tariffs on hundreds of billions of dollars of Chinese products in place.
In addition to the pro-market sentiment from the developments on trade, another headwind has been removed for the next couple of weeks. Fed speeches will be void of markets over the next couple of weeks as they enter their quiet period. And of course this comes at a time when the yield curve moves from inverted to steepening. During the past trading week, investors witnessed the longstanding 3-month/10-year Treasury inversion finally un-invert and begin to steepen. This was the first time since May 2019 that the front end of the yield curve un-inverted.
(Click on image to enlarge)
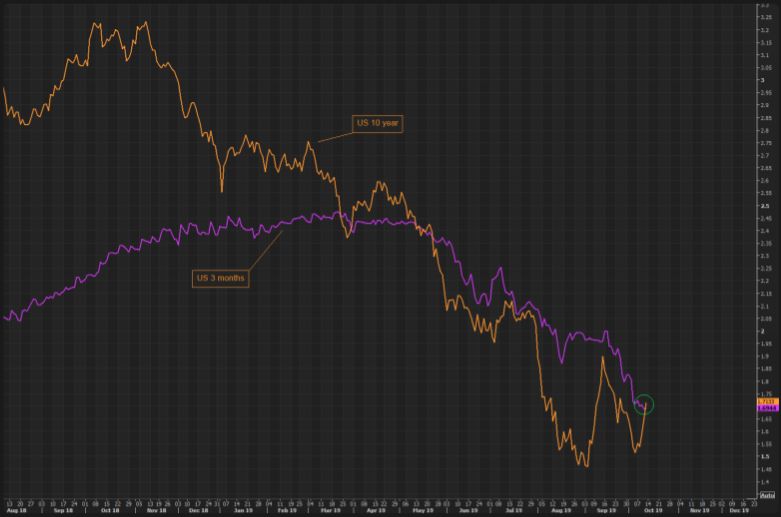
While this seems a positive development on the surface, as it provides financial institutions with net profit margins from lending activity, historically it doesn't bode well for the duration of a bull market and economic expansion. This is something pointed out by Sven Henrich in his latest Op-Ed/rant via Zerohedge.
The chart that says we are at the beginning of the end is why the Fed is beginning another round of QE, says Henrich. First comes the yield curve inversion, then comes the steepening, and that’s exactly what happened this week:
(Click on image to enlarge)
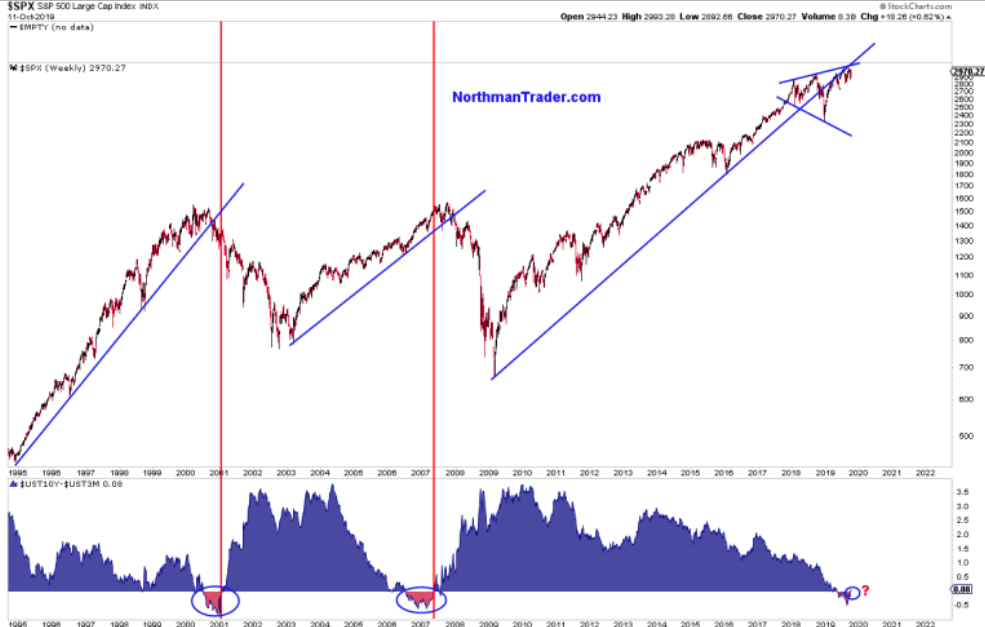
The chart atop is of the S&P 500 and the chart at the bottom is the periods whereby the 3-month/10-year Treasury yields flattened for a long period of time, inverted and then un-inverted (in red). Correlated with the S&P 500 chart, the un-inversion period is followed by a bear market dating back to the dot-com bubble and 2008 financial crisis. It's a sample size of 2 displayed until the present, and of course the bear market of 2001 was not caused by the yield curve steepening but by the 9-11 event. Additionally, yield curves steepen in recessions when the Fed cuts rates. There are only 3 periods in which the yield curve flattened for a long time, inverted, then steepened: January 2001, April 2007, and of course the present! So it's a sample size of 3 with a yet to be known outcome from the present sample. (Data and chart via Sentiment Trader)
(Click on image to enlarge)
With that being said, Sven Henrich continues his rant by stating the following:
"Why are central bankers acting like there is a global crisis? Because they know exactly the history of this chart and hence they are trying everything in their power to avert the inevitable. And if that means they have to lie and not call it QE then that’s what they have to do."
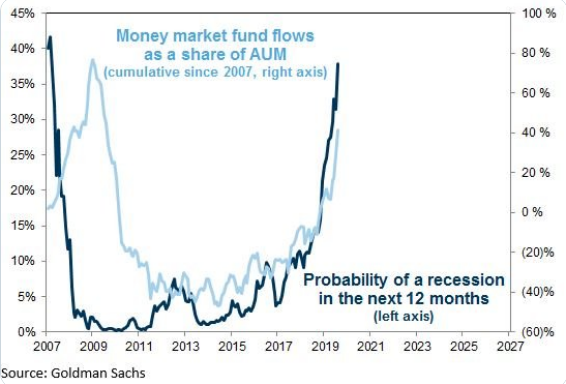
As we've learned over the years, much of what Sven Henrich offers from the permabear camp doesn't come to fruition, but this doesn't mean we shouldn't pay attention to what the yield curve is suggesting going forward. In addition to the Zerohedge featured publication from Sven Henrich over the weekend, the fear mongering financial media site is also circulating a recent note from J.P. Morgan Chase that dove tails wells with what's taking place in certain investor surveys.
(Click on image to enlarge)
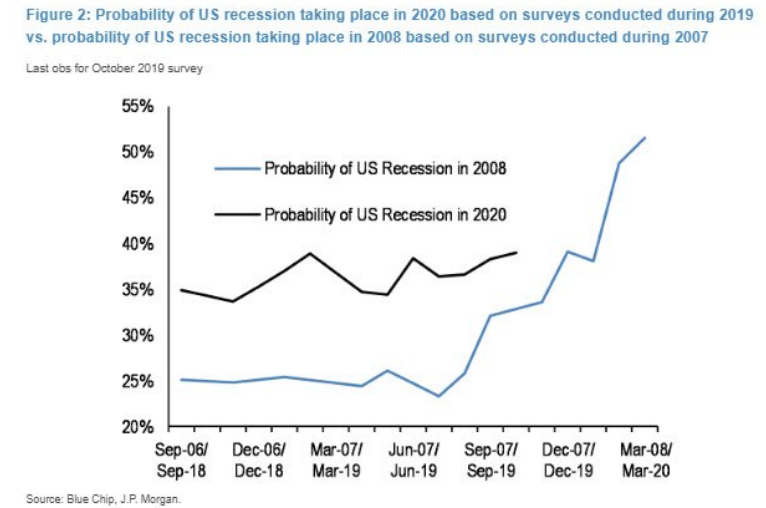
Akin to Henrich's chart, the recession probability chart from J.P. Morgan is a small sample comparison chart. It eerily compares the marked recession probability month-by-month in 2019 with that from 2007-2008. Unfortunately, the comparison lines up very well, suggesting that what is being signaled today in the way of recession probabilities was no different from the 2007-2008 period. Put another way; this is exactly the type of permabear fodder that Zerohedge loves to push out into the investor community. Based on fund flow data, does Zerohedge really need additional fodder?
An analysis from research firm DataTrek, drawing on fund flow data from the Investment Company Institute, shows that there was $3.4 trillion in U.S. money market funds as of October 2. That’s about 14% higher than at the end of 2018, and has risen nearly every week since May.
“What’s strange about this recent influx of capital is that short-term rates have been declining all year,” DataTrek founder Nicholas Colas wrote. Money market funds “are seeing strong inflows in 2019 even as 2-year yields have been cut in half.
With so many hurdles for markets over the coming weeks, higher defensive positioning is more likely a red flag than a trading strategy."
It has been pretty clear that over the last few years, investors have been net sellers of equities and equity funds.
(Click on image to enlarge)
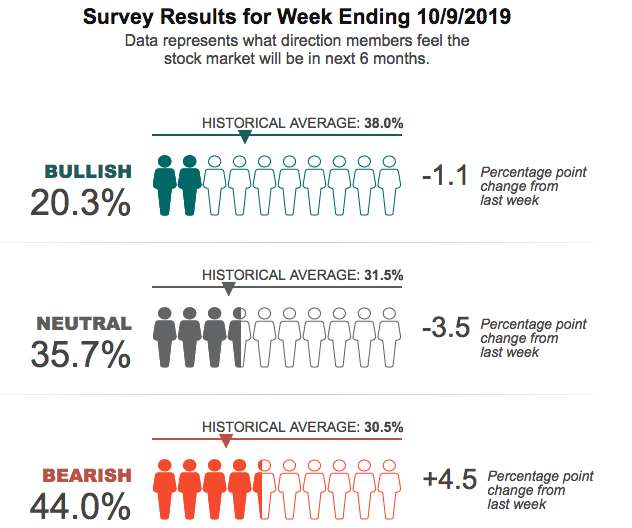
In addition to the outsized flows into money market and bond funds, investor sentiment has been extremely poor. The latest AAII survey found sentiment continued to build in favor of the bears. Bullish sentiment continues to wane as the market consolidate for 3 weeks, leading up to a slight gain in the past trading week.
(Click on image to enlarge)
Another way to look at the bearish sentiment, however, is through the lens of a contrarian indicator. The following chart identifies periods whereby the AAII survey produced such bearish sentiment. From the chart we can then look back on history and see what the stock market expressed during such time periods and answer the question, "What were S&P 500 returns when bullish sentiment was this low in the past?"
(Click on image to enlarge)
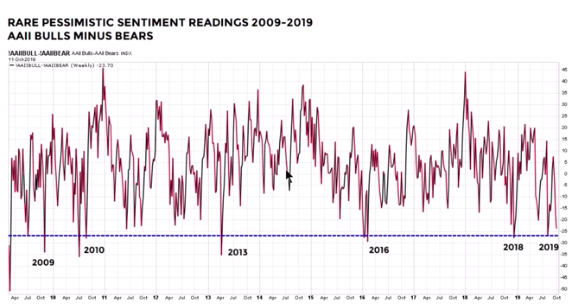
Pessimism remains unusually low as defined in the chart of bulls minus bears positioned above. In reality and historically, good things tend to occur in the S&P 500 when pessimism becomes extremely low. The following table from Ciovacco Capital identifies such market sentiment and S&P 500 returns in the following months and years. One month later, the S&P 500 was higher 75% of the time.
(Click on image to enlarge)
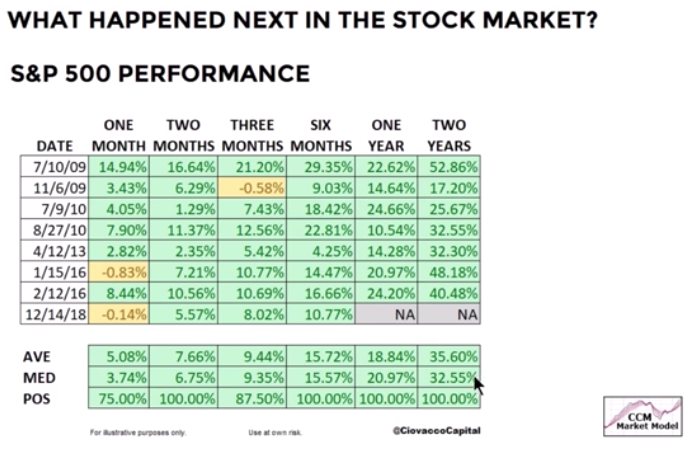
Across virtually all-time frames, the market is higher once sentiment becomes this bearish. There is always something to worry about as an investor and as it pertains to the financial markets, but after the past trading week's headlines, there are fewer things to worry over. You'll here a good deal about the equity market giving up a goodly portion of its gains after the China de-escalation deal was announced, but this is more noise than it is substance. The indices were set up rather perfectly for a 'sell the news' reaction to a vague deal that still demands signatures. However, the selling was limited to just the intraday gains. The S&P 500 ended up closing almost exactly where it opened, but left a gap on the charts.
The good news is that this distraction will come to an end at least for a little while. Market participants have been cautious, as they have had to wait for the next headline on China trade all week. With that now out of the way, we may be able to focus more on individual stock picking just as earnings season is about to kick into high gear.
Moving further into the final quarter of the year and toward the best 6 month period to own equities historically, there are always risks to be aware of. Those risks shouldn't curtail your long-term outlook, however, and as the market has proven historically. Some of these effects from de-escalation will prove immediate.Others will require the changing mood of investors. Trade safely and with a macro thesis, while addressing long-term goals!


