Apple Reaches $2 Trillion Market Cap
Apple (AAPL) has become the first US company to reach a market cap of $2 trillion. Over the past two years, the company's stock price has doubled in valuation with help from an influx of investors into big tech over the coronavirus pandemic period.
It was only in August 2018 that Apple first reached the $1 trillion market cap level. Other big tech companies such as Amazon, Microsoft and Alphabet soon followed suit. Investors are already gearing up for one of these companies to become the second $2 trillion market cap company in the US.
In the company's latest third-quarter earnings announcement, Apple showed revenue of $59.7 billion with double-digit growth in both services and its products. This was even among the lockdown period when many Apple stores were closed.
The long-term future received a big thumbs up from Warren Buffett who finally decided to invest in a technology company in May 2016. Through his investment company, Berkshire Hathaway, they own around 245 million shares which amount to around a 5.7% stake in the company which is now worth more than $110 billion.
The question on every investors' mind now is whether it can get to a $3 trillion market cap.
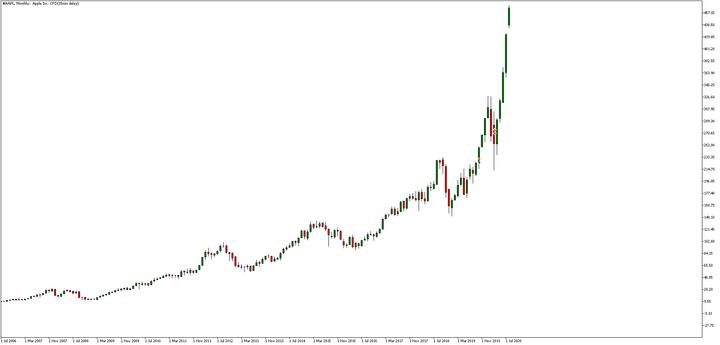
Below is the long-term, monthly chart of Apple's share price:

Source: Admiral Markets MetaTrader 5, #AAPL, Monthly - Data range: from 1 July 2006 to 20 August 2020. Please note: Past performance is not a reliable indicator of future results.
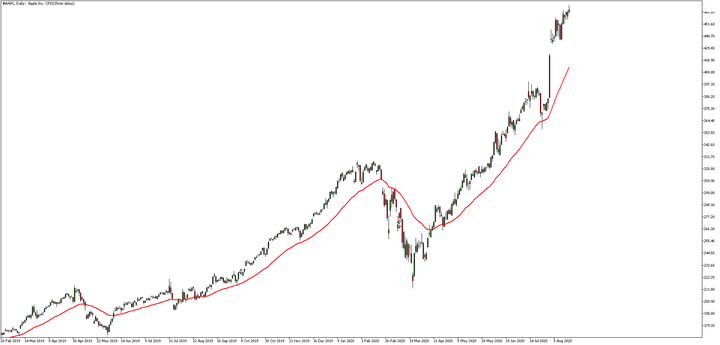
It's clear to see the long-term uptrend in the price chart above. As the trend is so strong traders may view the lower timeframes to identify potential levels to buy or sell. This could be the daily chart, four-hour chart or even the one-hour chart as well. Below is a chart of Apple's share price on the daily chart.

Source: Admiral Markets MetaTrader 5, #AAPL, Daily - Data range: from 20 Feb 2019 to 20 Aug 2020. Please note: Past performance is not a reliable indicator of future results.
In the daily price chart above the red line is the 36-period exponential moving average. When price action is above the moving average it tends to attract more buyers to the market driving price higher. Traders will often use moving averages to identify the trend but also potential turning points in the market.
For example, on the recent rally higher price action has frequently bounced off the moving average. Some traders may use smaller period moving averages like the 10-period or 21-period exponential moving averages to look for more frequent bounces. The preference comes down the chosen style of the trader.
The price bars on the daily chart have already overextended away from the moving average so traders may go to even lower timeframes to try and capitalise on any further upside left or wait for the market to pull back to a level of support like a moving average or trend line.
Disclaimer: The given data provides additional information regarding all analysis, estimates, prognosis, forecasts or other similar assessments or information (hereinafter "Analysis") ...
more


Not even remotely surprised!