
(Click on image to enlarge)
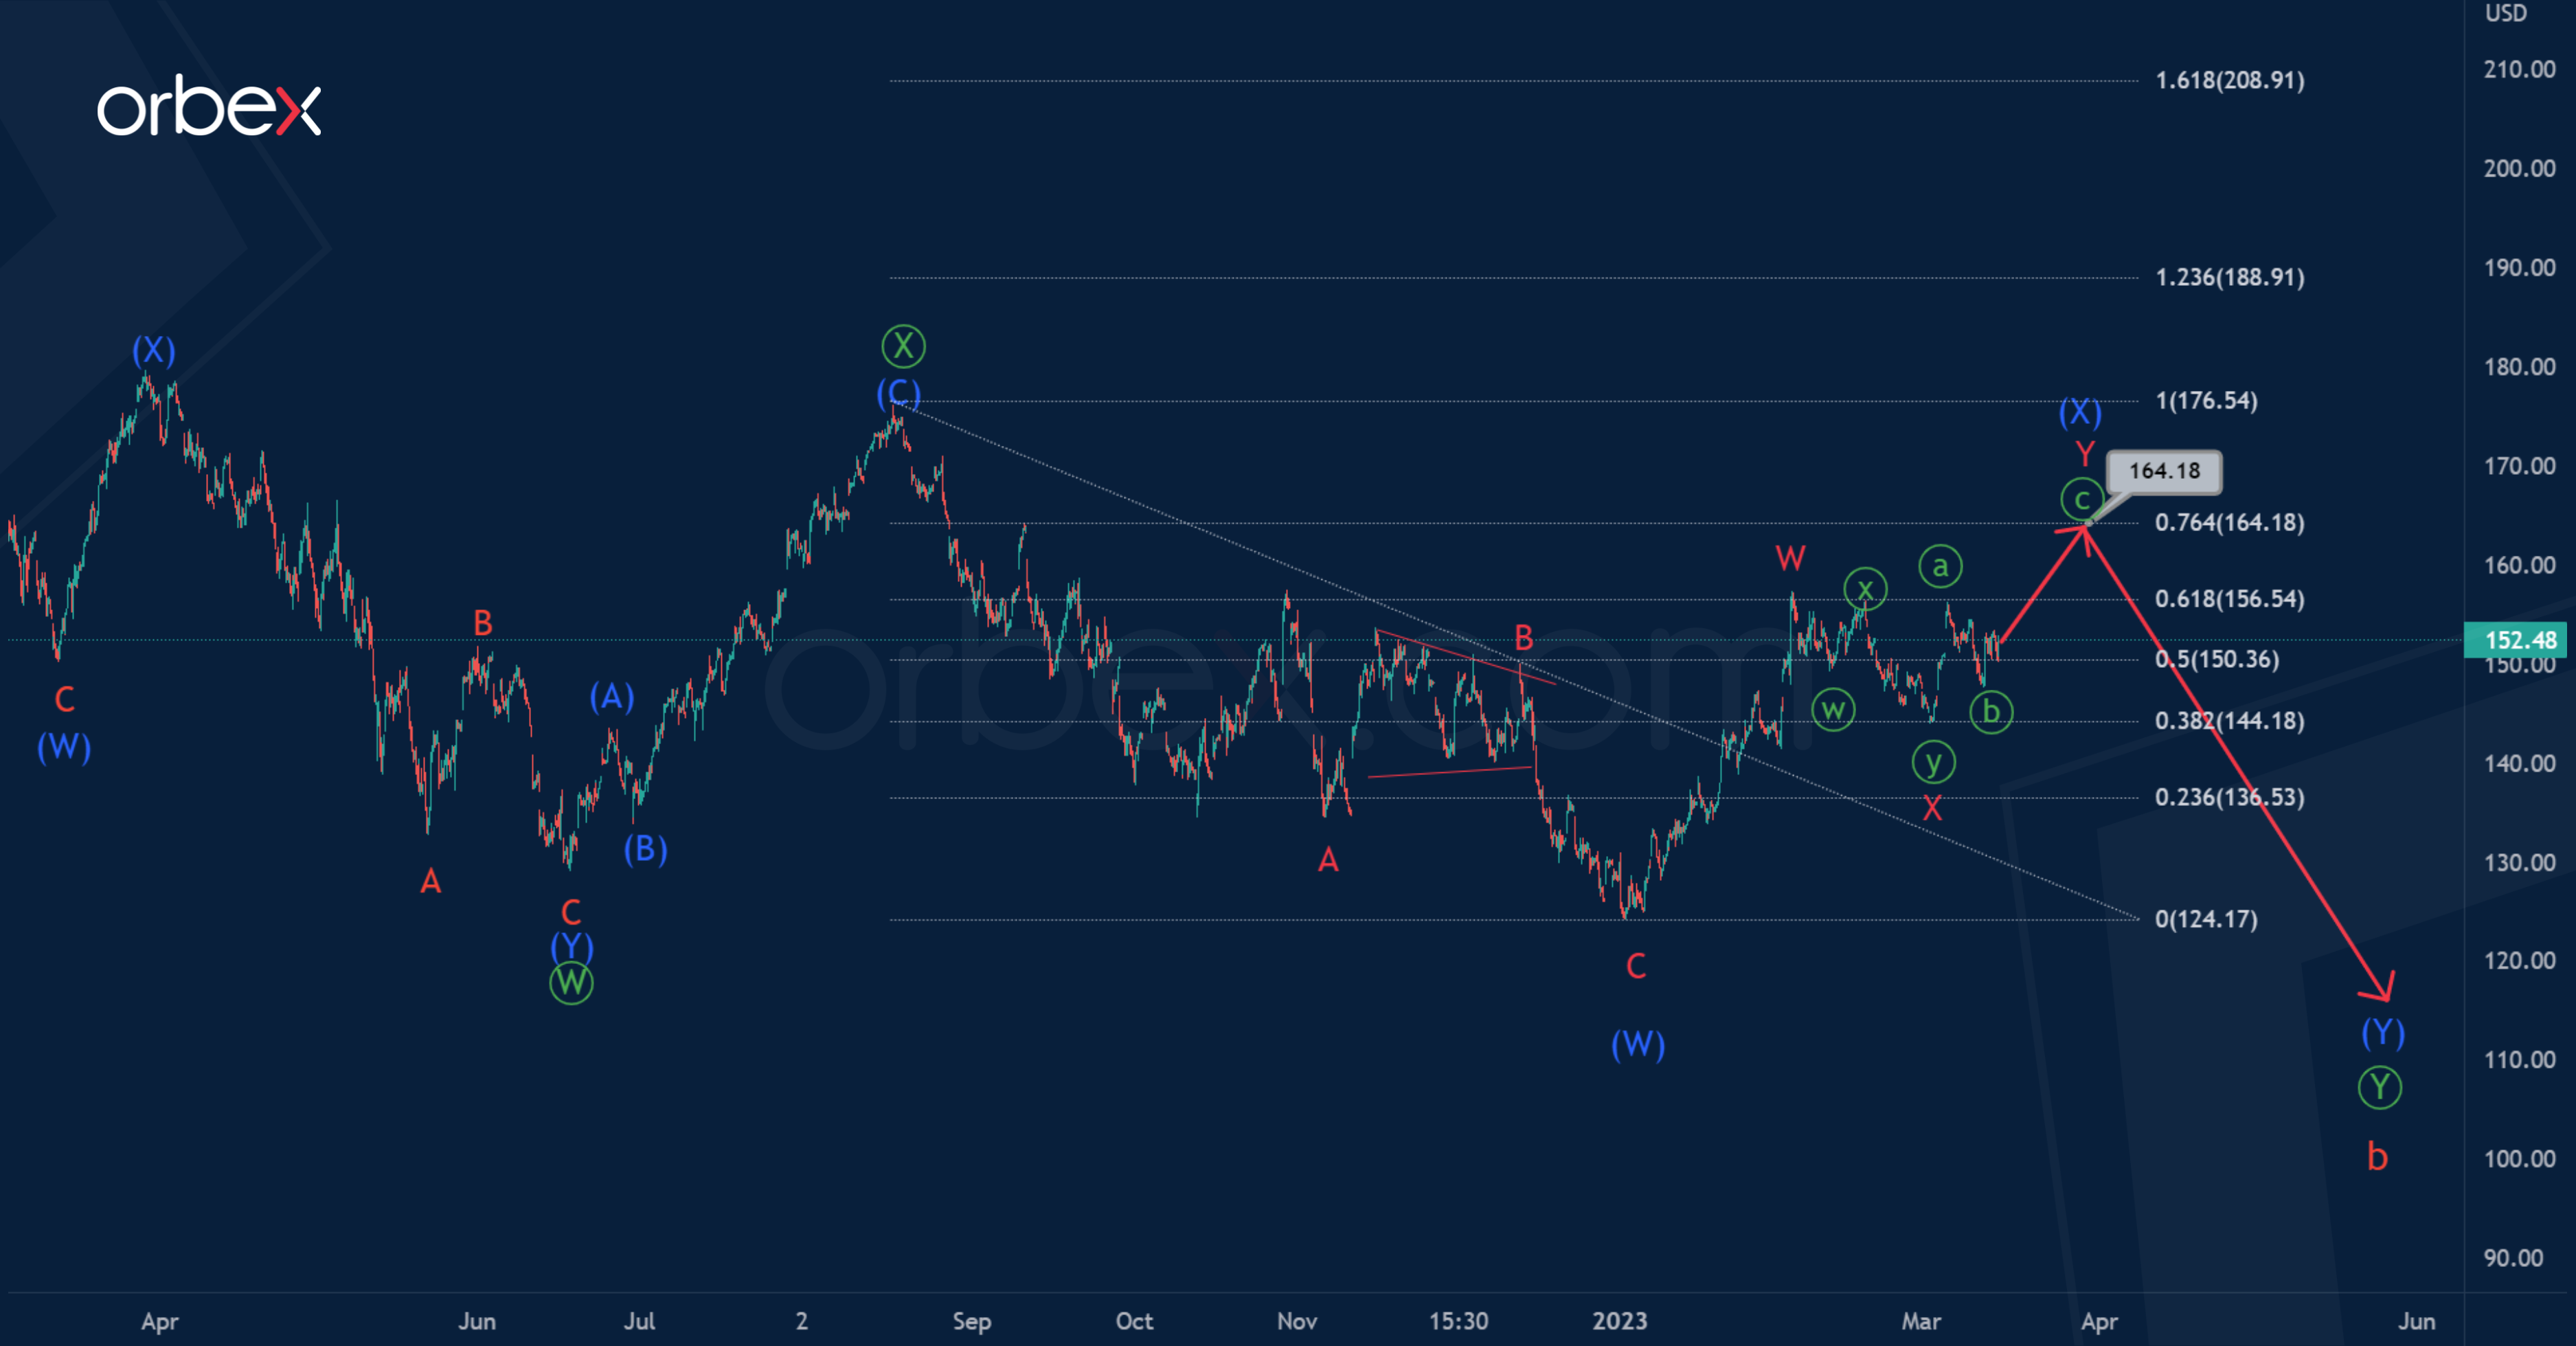
The current Apple (AAPL) structure suggests the formation of a corrective pattern taking the form of a cycle zigzag a-b-c.
Most likely, a complex correction b is formed, taking the form of a primary double zigzag Ⓦ-Ⓧ-Ⓨ. The actionary leg Ⓦ and the zigzag intervening wave Ⓧ look completed, and the last sub-wave Ⓨ is still under development.
The wave Ⓨ is similar to the intermediate double zigzag (W)-(X)-(Y).
The price could soon rise to 164.16 and complete the intervening wave (X). At that level, it will be at 76.4% of actionary wave (W).
(Click on image to enlarge)

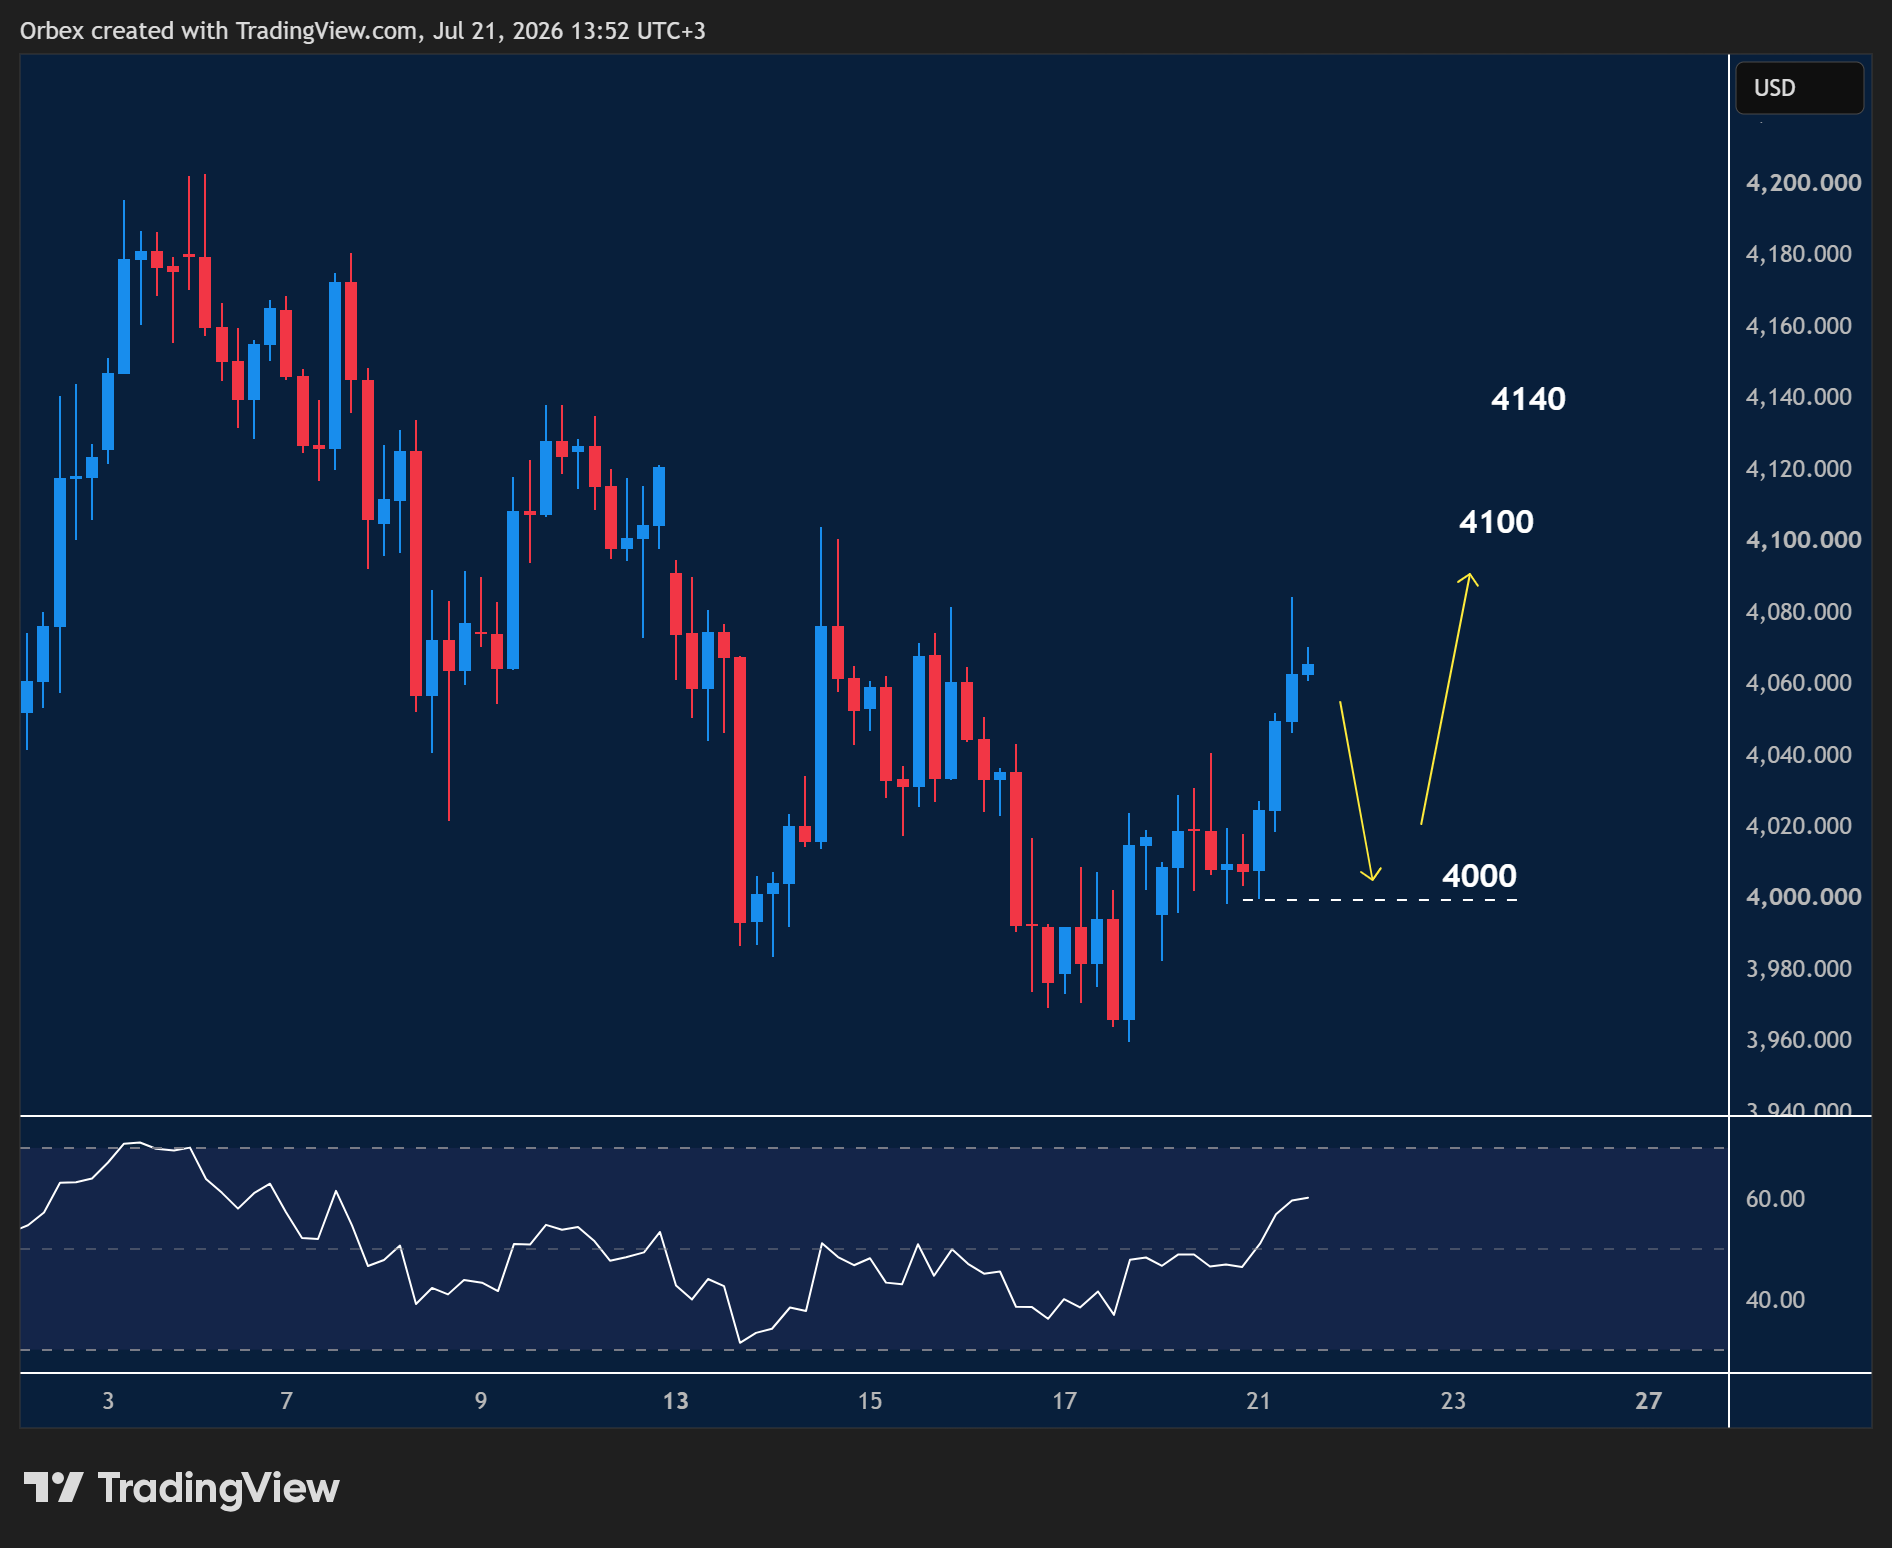
Let’s consider an alternative scenario in which waves (W) and (X) have ended.
It is possible that the market is now in the last sub-wave (Y). Perhaps it will be a minor triple zigzag, as shown in the chart.
The price in the specified wave (Y) could fall to 109.20. At that level, wave Ⓨ will be at 123.6% of Ⓦ.
More By This Author:
Intraday Analysis – USD Struggles For Bids, Wednesday - March 15
US February CPI And The Fading Fed Hike Prospects
AUDUSD Has The Intermediate Correction (B) Ended?


Comments
Log in or sign up to join the conversation.