
Summary
- 100% technical buy signals.
- 14 new highs and up 47.67% in the last month.
- 317.55% gain in the last year
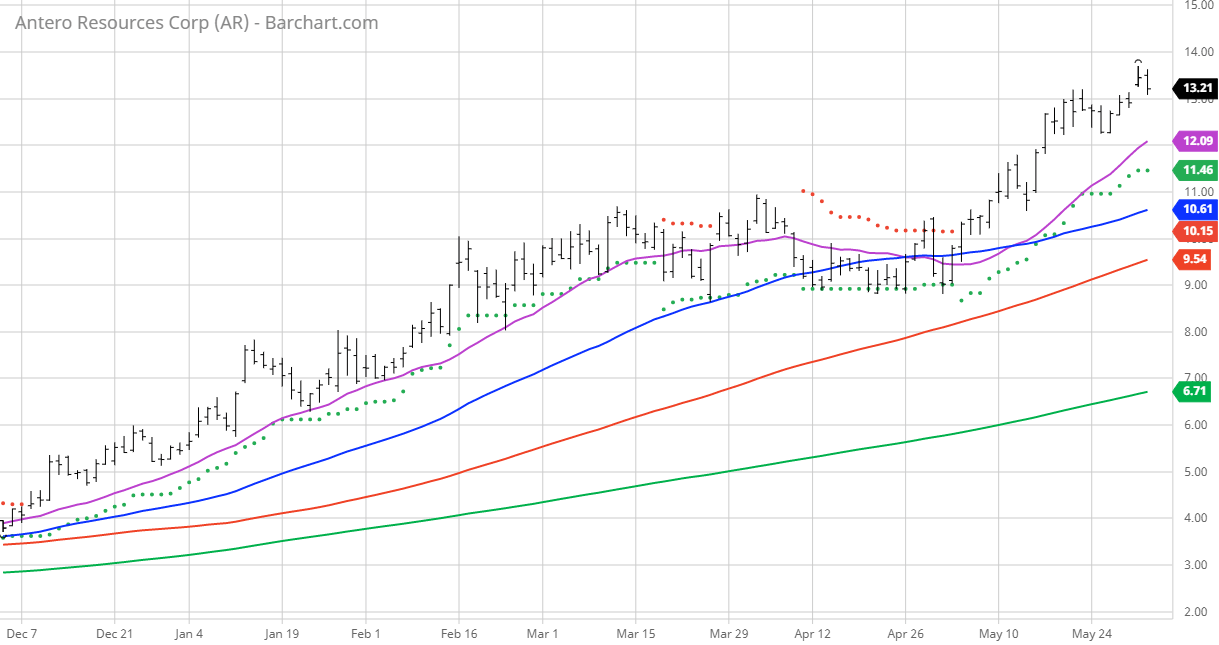
The Barchart Chart of the Day belongs to the oil and gas company Antero Resources (NYSE: AR). I found the stock by using Barchart's powerful screening tools to find the stocks with the highest Weighted Alpha and technical buy signals. After I sorted for the most frequent number of new highs in the last month, I used the Flipchart feature to review the charts for consistent prices appreciation. Since the Trend Spotter signaled a buy on 5/4 the stock gained 317.55%.
Antero Resources Corporation, an independent oil, and natural gas company acquires, explores for, develops, and produces natural gas, natural gas liquids, and oil properties in the United States. As of December 31, 2019, the company had approximately 451,000 net acres in the southwestern core of the Marcellus Shale; and 91,000 net acres in the core of the Utica Shale. It also owned and operated 324 miles of gas gathering pipelines in the Marcellus Shale; 17 compressor stations in the Marcellus Shale; 110 miles of low-pressure and high-pressure gathering pipelines in the Utica Shale; 8 miles of high-pressure pipelines; and 2 compressor stations in the Utica Shale. The company had estimated proved reserves of 18.9 trillion cubic feet of natural gas equivalent, including 11.5 trillion cubic feet of natural gas; 652 million barrels of assumed recovered ethane; 540 million barrels of primarily propane, isobutane, normal butane, and natural gasoline; and 42 million barrels of oil. The company was formerly known as Antero Resources Appalachian Corporation and changed its name to Antero Resources Corporation in June 2013. Antero Resources Corporation was founded in 2002 and is headquartered in Denver, Colorado.
Barchart technical indicators:
- 100% technical buy signals
- 296.94+ Weighted Alpha
- 317.55% gain in the last year
- Trend Spotter buy signal
- Above its 20, 50, and 100 day moving averages
- 14 new highs and up 47.67% in the last month
- Relative Strength Index 67.63%
- Technical support level at 13.24
- Recently traded at 13.23 with a 50 day moving average of 10.62
Fundamental factors:
- Market Cap $4.07 billion
- P/E 61.48
- Revenue expected to grow 31.00% this year but be down 7.10% next year
- Earnings estimated to increase 310.70% this year, decrease by 55.10% next year and continue to shrink by an annual compounded rate of 29.79% for the next 5 years
- In spite of those projections Wall Street analysts issued 6 strong buy, 8 buy, and 12 hold recommendations on the stock
- The individual investors following the stock on Motley Fool voted 39 to 10 that the stock will beat the market
- 17,290 investors are monitoring the stock on Seeking Alpha


Comments
Log in or sign up to join the conversation.