
The 10 largest public companies in the world had a combined market capitalization of nearly $12 trillion as of July 2022.
But two decades ago, the players that made up the list of the largest companies by market capitalization were radically different—and as the years ticked by, emerging megatrends and market sentiment have worked to shuffle the deck multiple times.
This racing bar chart by Truman Du shows how the ranking of the top 10 largest public companies has changed from 2000 to 2022.
Market Cap vs. Market Value
Before diving in, it’s worth noting that market capitalization is just one of many metrics that can be used to help value a company.
Simply put, a company’s market cap measures the combined price of a company’s outstanding shares—in other words, it’s the price someone would pay if they wanted to purchase the company outright at current stock prices (theoretically speaking).
But while a market cap provides insight into what equity is worth at a given time, calculating the market value is far more complicated and nuanced. After all, a price paid might not reflect the actual value of a business. To get a measure of value, other metrics like a company’s price-to-sales (P/S) ratio, price-to-earnings (P/E) ratio, or return-on-equity (ROE) may be considered.
The Largest Public Companies by Market Cap (2000–2022)
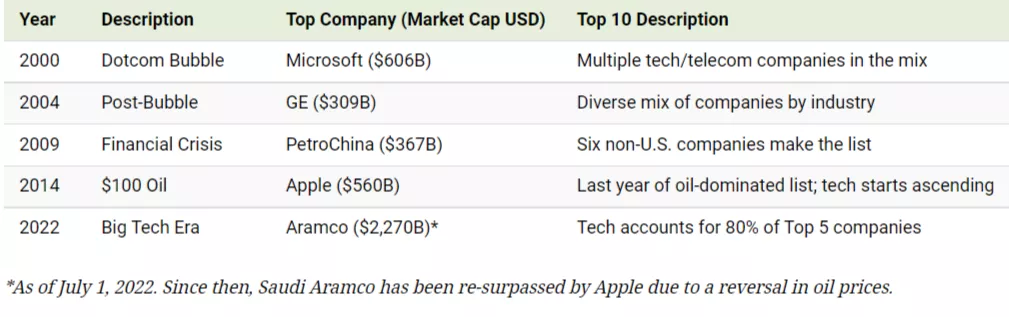
Over the last two decades, investor sentiment has shifted as different trends have played out, and the types of companies buoyed up by the market have changed as well.
For instance, tech and telecom companies were big in the very early 2000s, as investors got excited about the seemingly endless potential of the newly-introduced World Wide Web.
Largest Companies by Market Cap (January 1, 2000)
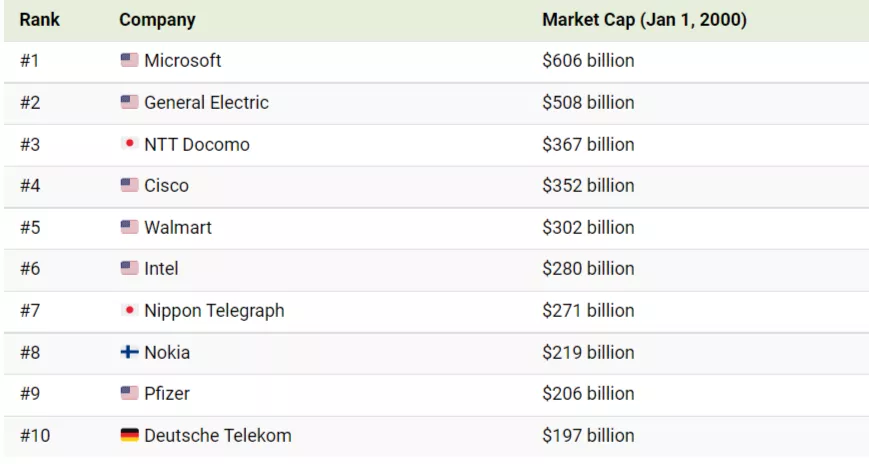
In the middle of the Dotcom bubble, investors were pouring money into internet-related tech startups. As PC and internet adoption picked up, investors hoped to “get in early” before these companies started to really turn a profit. This overzealous sentiment is reflected in the market capitalizations of public companies at the time, especially in the tech or telecom companies that were seen as benefitting from the internet boom.
Of course, the Dotcom bubble was not meant to last, and by January 2004 the top 10 list was looking much more diverse. At this time, Microsoft had lost the top spot to General Electric, which had a market cap of $309 billion. Then in the late 2000s, energy companies such as ExxonMobil, PetroChina, Gazprom, and BP took over the list as oil prices spiked well over $100 per barrel.
But fast forward to 2022, and we’ve come full circle, with Big Tech back in the limelight again.
Largest Companies by Market Cap (July 1, 2022)
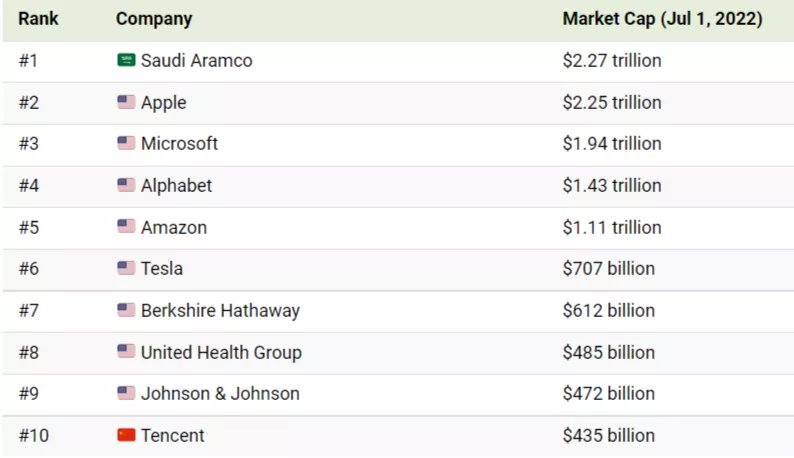
Four of the five largest companies are in tech, and Tencent also cracks the list. Meanwhile, Tesla is classified as an automotive company, but it is thought of as an “internet of cars” company by many investors.
Big Picture Trends in the Top 10 by Market Cap List
Trending Downwards?
Amidst rising interest rates, crippling inflation, and political issues like the ongoing conflict in Ukraine, signs point towards a potential global recession. Tech companies fared well during the COVID-19 pandemic, but will likely not be immune to the impacts of a generalized economic slowdown.
It’ll be interesting to see how things pan out in 2023, and which companies (if any) will manage to stay on top throughout the turmoil.
More By This Author:
Animation: Berkshire Hathaway’s Holdings Since 1994
Netflix Vs Disney: Who’s Winning The Streaming War?
Infographic: Markets Comparing the Speed of U.S. Interest Rate Hikes (1988-2022)


Comments
Log in or sign up to join the conversation.