
In this technical blog, we will look at the past performance of the 1-hour Elliott Wave Charts of Amazon ticker symbol: Amazon (AMZN). In which, the rally from 01 May 2023 low unfolded as an impulse structure. And showed a higher high sequence favored more upside extension to take place. Therefore, we advised members not to sell the stock & buy the dips in 3, 7, or 11 swings at the blue box areas. We will explain the structure & forecast below:
AMZN 1-hour Elliott Wave chart from 5.23.2023
(Click on image to enlarge)
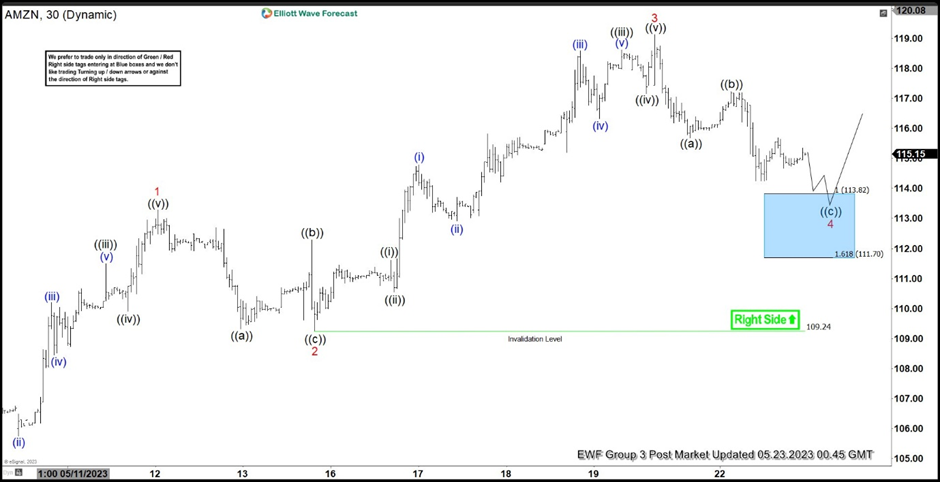
Here’s the 1hr Elliott wave chart from the 5/23/2023 Post-Market update. In which, the rally from the 5/01/2023 low unfolded in an impulse sequence where wave 1 ended at $113.28 high. Then wave 2 pullback ended at $109.24 & made a rally higher in wave 3 towards $118.75 high. Down from there, the stock made a pullback in wave 4 while the internals of that pullback unfolded as Elliott wave zigzag structure where wave ((a)) ended at $115.70 low. Wave ((b)) ended at $117.24 high and wave ((c)) managed to reach the blue box area at $113.82- $111.70 area. From there, buyers were expected to appear looking for the next leg higher or for a 3 wave bounce minimum.
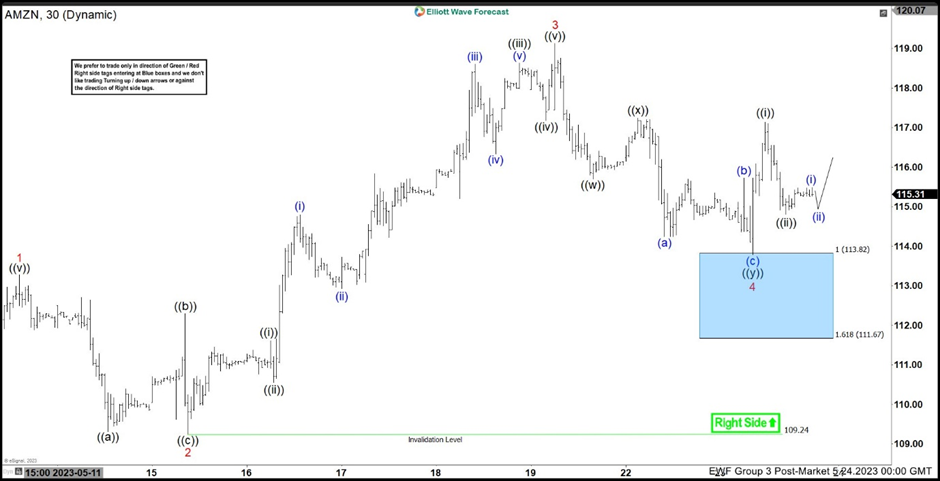
AMZN latest 1-hour Elliott Wave chart
(Click on image to enlarge)
More By This Author:
Oil Price Rallies On Saudi Oil Minister’s Comments, Inventory DrawdownUSD/JPY Bears In The Market And Eye Break Of Support Structure
Gold Price Forecast: XAU/USD Hangs Near Monthly Low On Modest US Dollar Strength


Comments
Log in or sign up to join the conversation.