Advanced Micro Devices Found Buyers After A Corrective Pull Back.
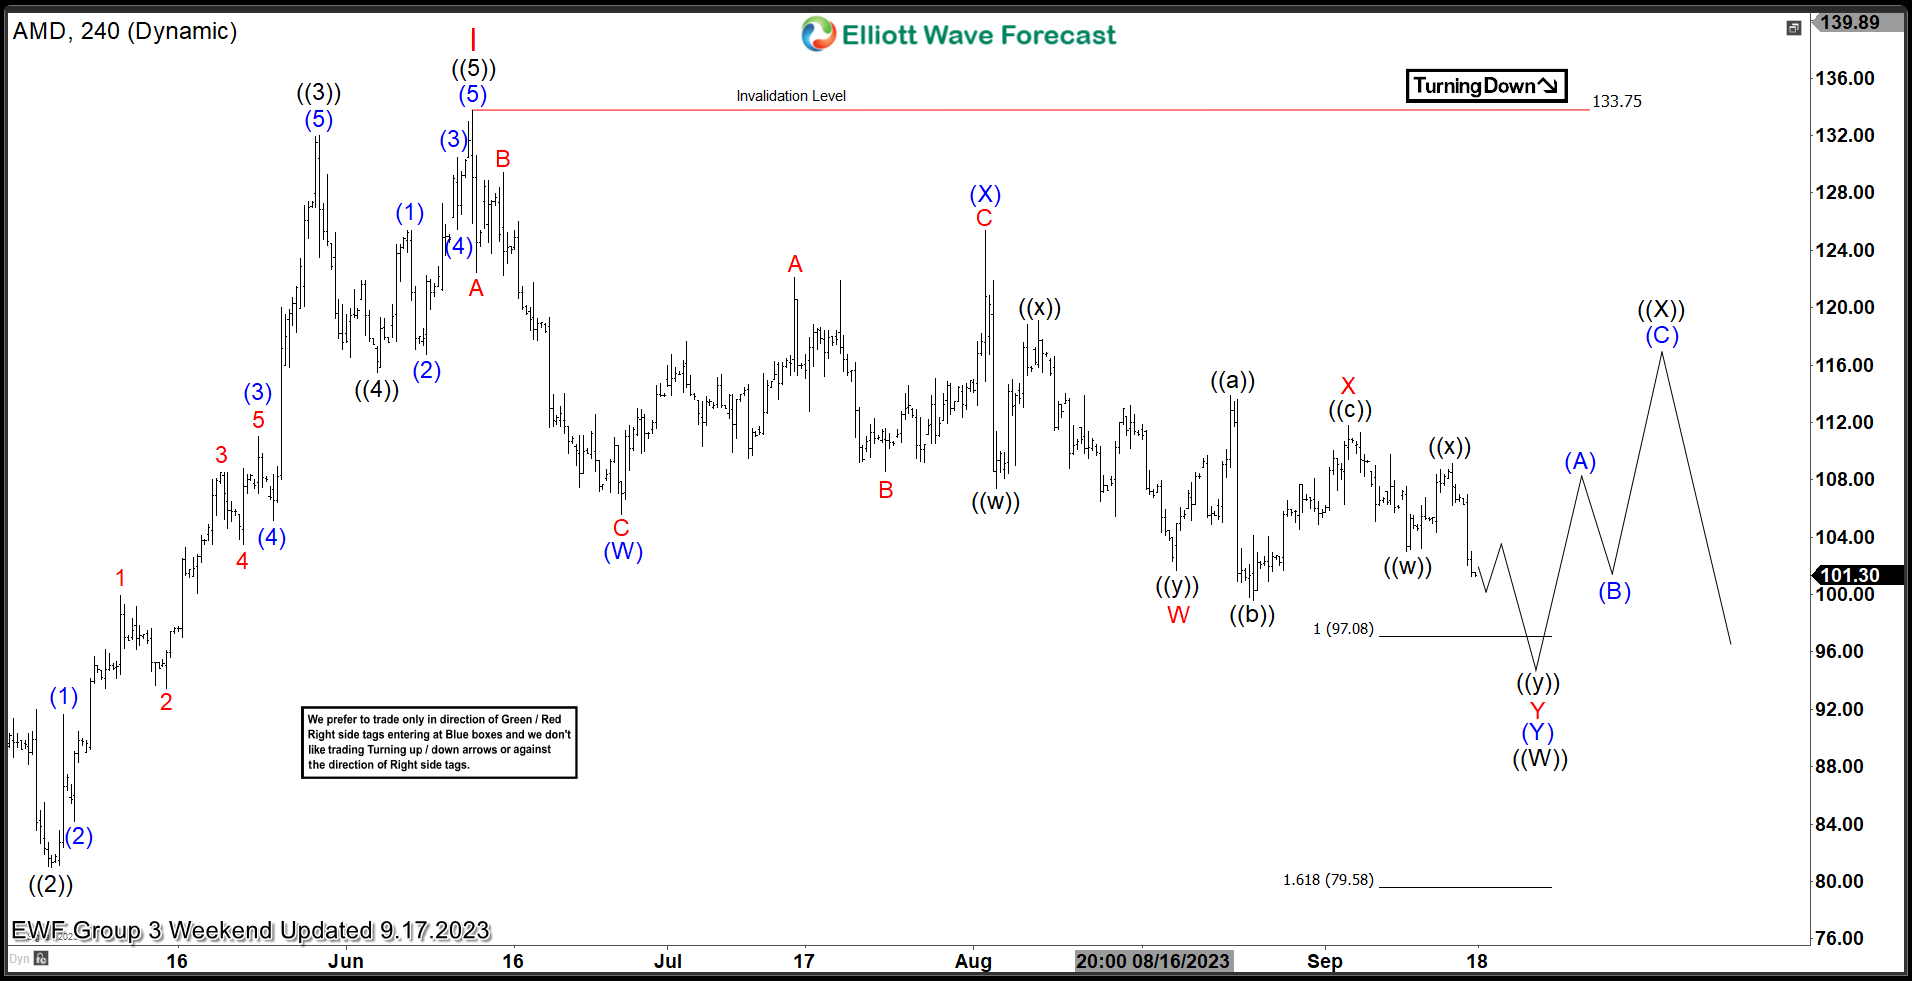
Hello everyone. In today’s article, we will look at the past performance of the 4 Hour Elliott Wave chart of Advanced Micro Devices, Inc. (AMD). The rally from 10.13.2022 low unfolded as a 5 wave impulse. So, we expected the pullback to unfold in 7 swings and find buyers again. We will explain the structure & forecast below:
$AMD 4H Elliott Wave Chart 9.17.2023:
Here is the 4H Elliott Wave count from 9.17.2023. The rally from 10.13.2023 peaked at red I and started a pullback to correct it. We expected the pullback to find buyers in 7 swings (WXY) at $97.08 – 79.58.
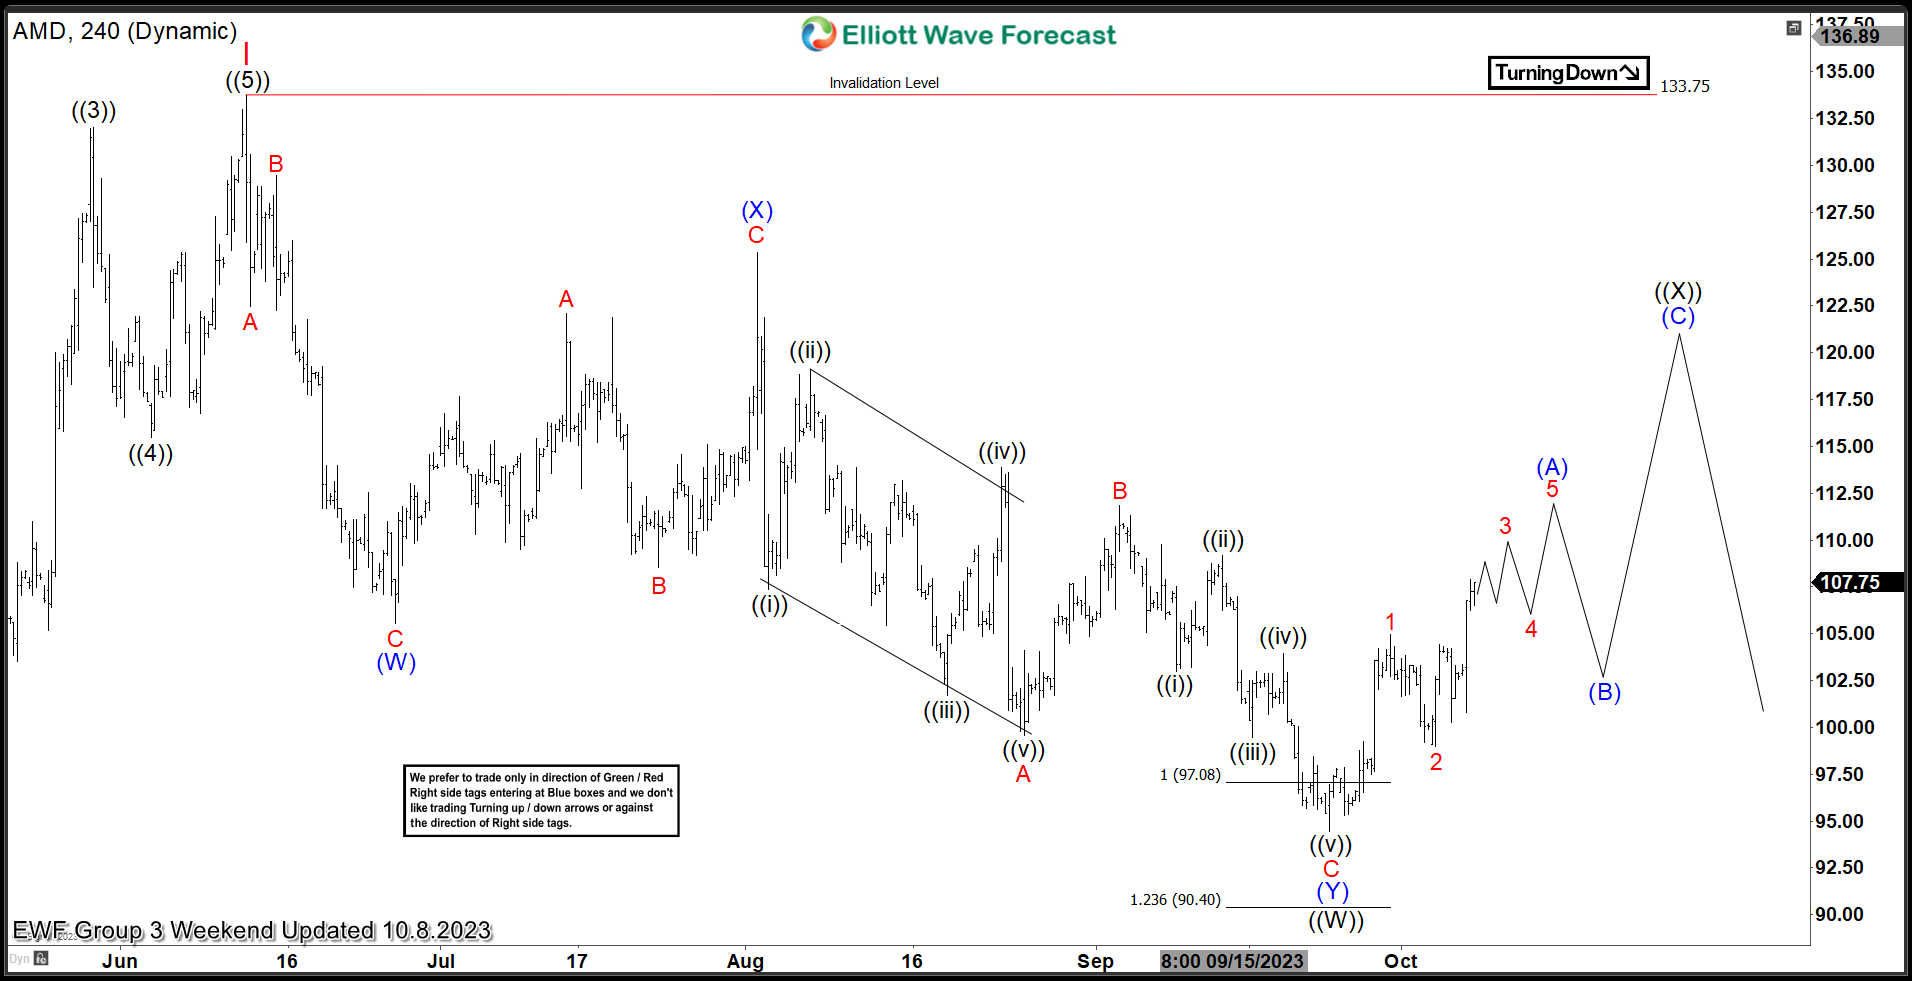
$AMD 4H Elliott Wave Chart 10.08.2023:
(Click on image to enlarge)
Here is the 4H update from 10.08.2023 showing the bounce taking place as expected. The stock has reacted higher after reaching the extreme area in 7 swings. We expect the stock to continue higher to correct the cycle from June 2023 peak allowing longs to get a risk free position before a pullback can happen.
More By This Author:
NVDA Looking for Zigzag CorrectionDuke Energy Navigating Rough Waters
GBPUSD: Sell Trade Hits Targets
Disclaimer: Futures, options, and over the counter foreign exchange products may involve substantial risk and may not be suitable for all investors. Leverage can work against you as well as for ...
more


