

Image Source: Unsplash
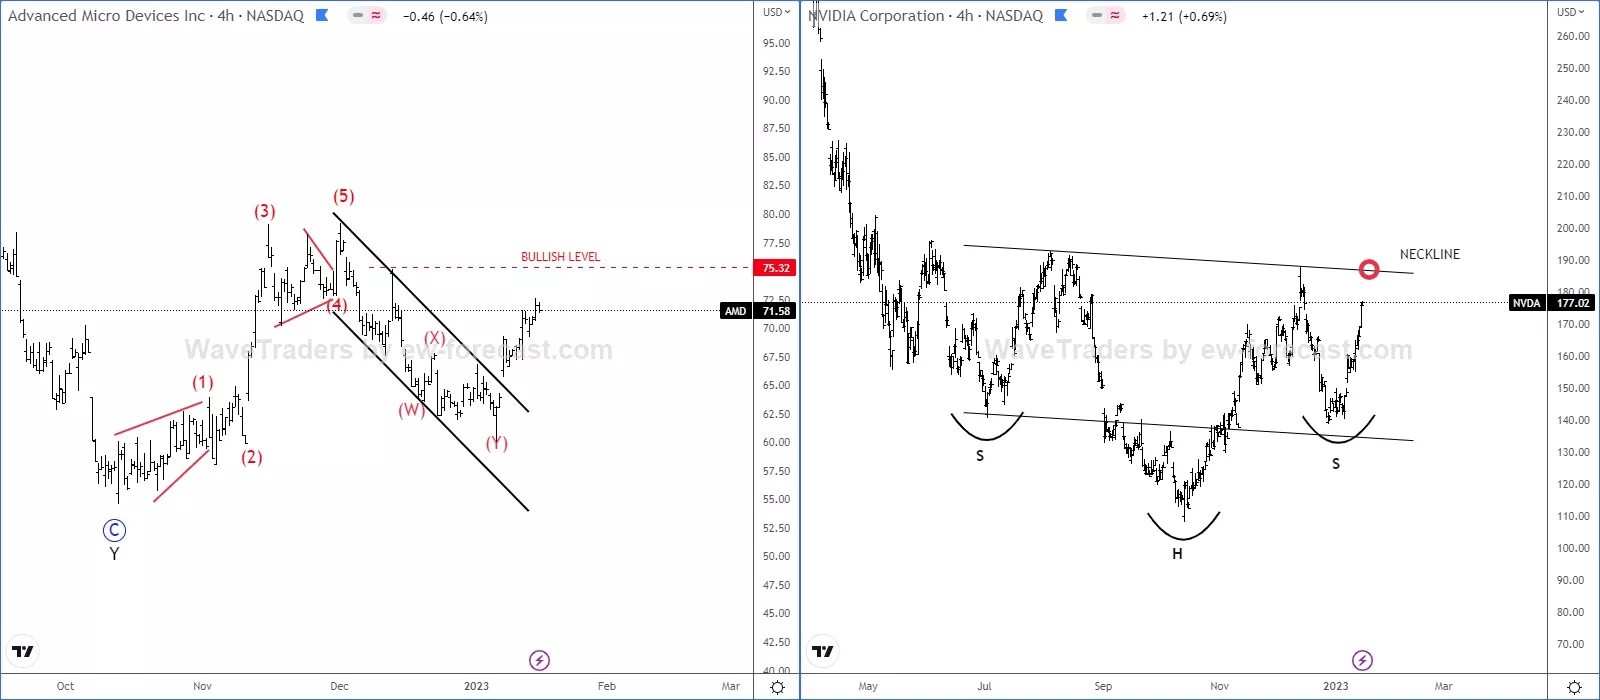
Looking at Advanced Micro Devices (AMD) and Nvidia (NVDA) 4-hour charts, we can see nice bullish setup patterns that can send the price higher. Nvidia is forming a potential inverted Head&Shoulders pattern, while AMD has a pretty clean bullish setup formation with five waves up from the lows followed by a complex W-X-Y correction. Well, if Nvidia breaks the neckline of the Head&Shoulders pattern and if AMD breaks above the 75 region, then stocks could easily stay in the uptrend.
(Click on image to enlarge)
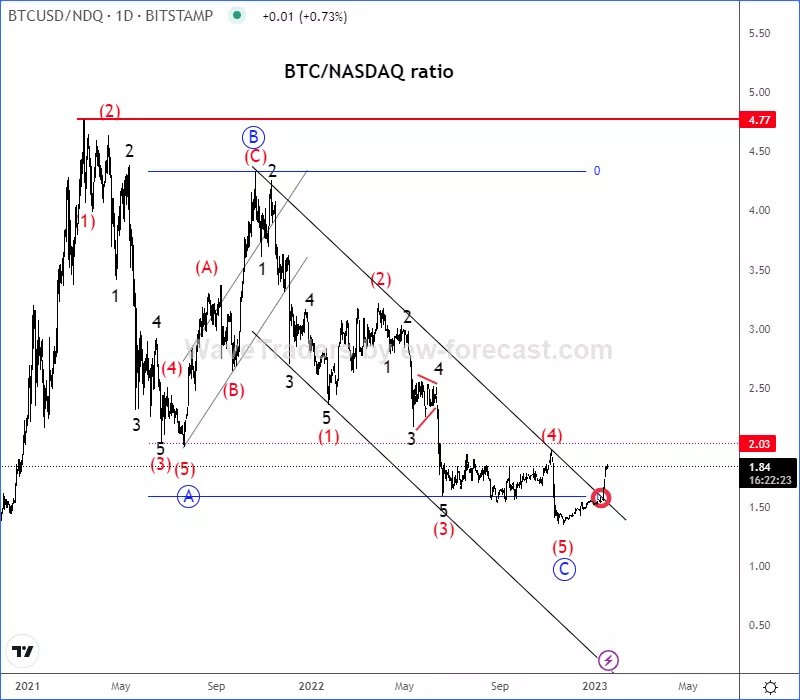
We don’t track single stocks regularly, but from time to time we share them in connection to cryptocurrencies, as the technology sector has a big impact on Bitcoin and friends. If we also take a look at BTC/Nasdaq ratio chart, we can now finally see it breaking above the channel resistance line after a completed five-wave cycle within wave C of an A-B-C correction. So, bulls could be back, especially if the ratio jumps back above the 2.0 region. The ratio is actually telling us which asset will be stronger/weaker, so if we consider that some single stocks could recover, then BTC could recover even more. One of the main reasons why stocks can be bottoming is speculation that Fed will stop raising rates this year as inflation is coming down, while jobs are still stable.
More By This Author:
Ethereum Classic Shows Support In Place
EURCAD Is Unfolding A Bullish Impulse
Bitcoin Is Forming The Wedge Pattern


Comments
Log in or sign up to join the conversation.