
Activision Blizzard Stock Soars On Microsoft Acquisition News; Chart Says Proceed With Caution

Microsoft Corp MSFT announced on Tuesday its plans to acquire gaming giant Activision Blizzard Inc's ATVI for $95 per share in an all-cash transaction valued at $68.7 billion.
The acquisition will help to erase the association of widespread sexual misconduct, gender discrimination and retaliation with Activision Blizzard's library of popular games such as Diablo and Call of Duty.
The game developer and interactive entertainment content publisher gapped up about 32% higher on the news, but immediately ran into a group of profit takers who caused the stock to fall about 4% off the open.
At least one trader may have received inside information prior to the announcement because on Thursday after the market closed a massive block trade was placed for 981,713 shares at the $64.17 ask. The trade represented a $62.99 million bet Activision Blizzard would trade higher.
If that trader sold their shares at the Tuesday’s $86.90 high-of-day, they would have banked over $22 million in profit.
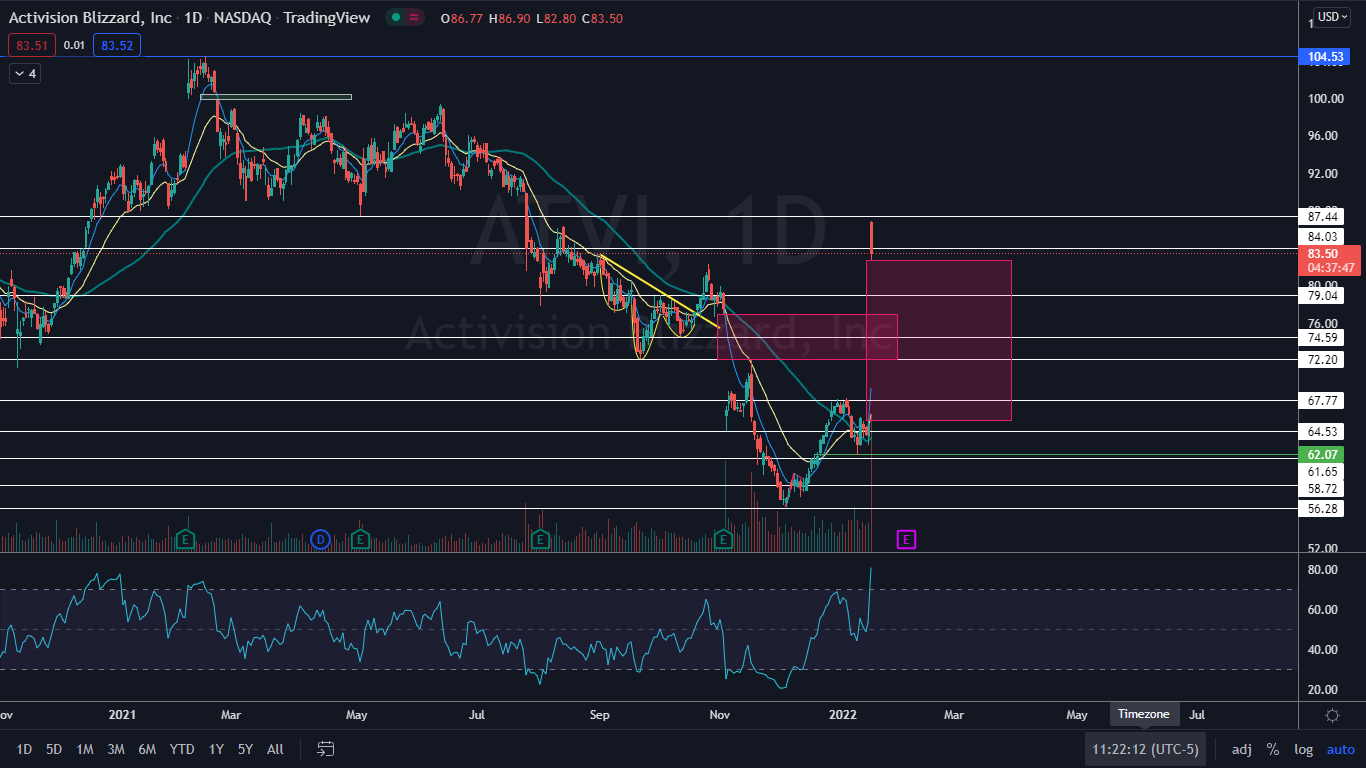
The Activision Blizzard Chart: Although partly propelled by the acquisition news, Activision Blizzard was also set to trade higher because the stock had settled into a bull flag pattern on the weekly chart, with the pole created between the weeks of Dec. 6 and Dec. 27 and the flag formed over the two weeks that followed. The measured move of the bull flag was set at about 18%, which Activision Blizzard easily surpassed on Tuesday.
At midday, Activision Blizzard continued to hold most of its gains, but the large gap below may concern some bullish traders from opening new positions because gaps on charts fill about 90% of the time. Activision Blizzard now has a gap between $64.53 and $82.80.
Activision Blizzard’s relative strength index (RSI) has also flashed a warning sign because it is measuring in at about 80% on the daily chart. When a stock’s RSI reaches or exceeds the 70% level it becomes overbought, which can be a sell signal for technical traders, although it should be noted the RSI can remain extended for long periods of time.
The stock is trading above the eight-day and 21-day exponential moving averages (EMAs), with the eight-day EMA trending above the 21-day, both of which are bullish indicators. Activision Blizzard is also trading above the 50-day simple moving average, which indicates longer term sentiment is bullish.
The most likely scenario is for an inside bar pattern to develop on Wednesday as the stock consolidates. If that happens, traders can then watch for a break from the pattern to gauge future direction.
Activision Blizzard has resistance above at $84.03 and $87.44 and support below at $79.04 and $74.59.
(Click on image to enlarge)
© 2022 Benzinga.com. Benzinga does not provide investment advice. All rights reserved.


