
In order to generate value for his clients, an active investment manager must deviate from a passive benchmark—by choosing sectors, or styles, or individual stocks that the manager predicts will outperform. The manager’s value is dependent on the accuracy of his predictions; the better he is at identifying the best sectors, or styles, or stocks, the better his results will be. A passive manager, on the other hand, acknowledges his (literal) ignorance about future returns.
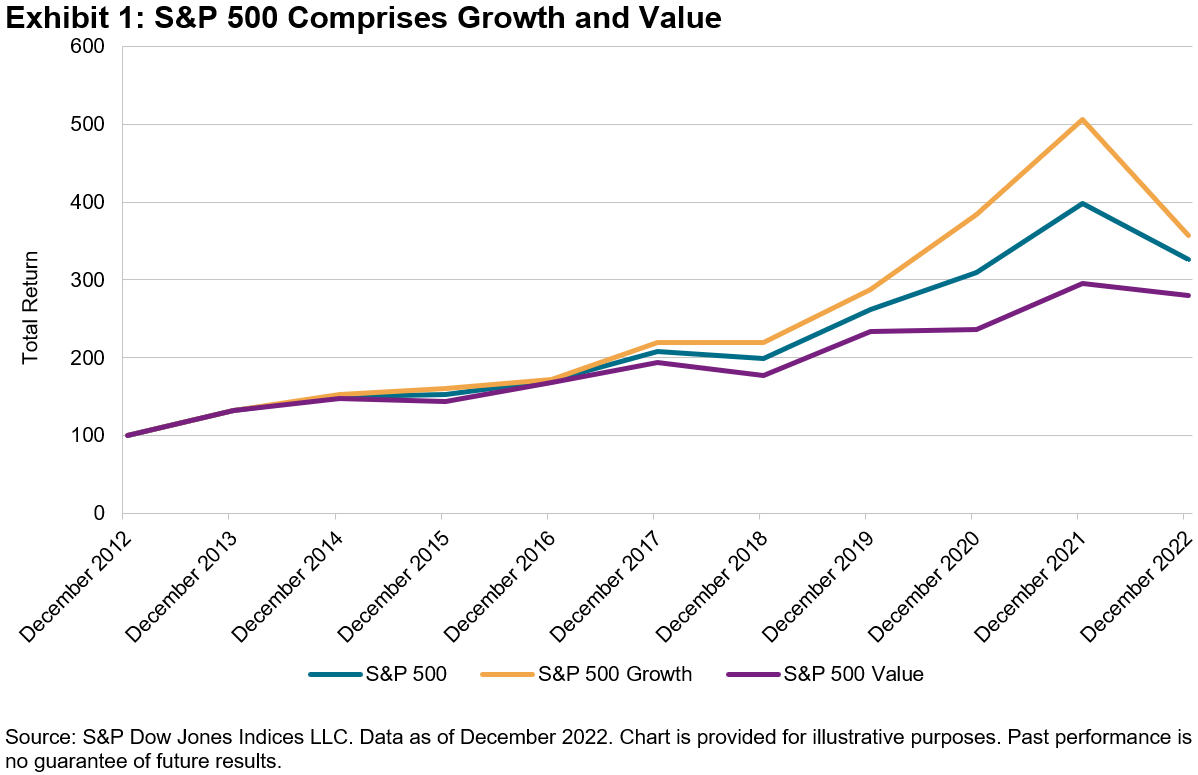
How accurate do active predictions need to be? How accurate are they in practice? A simple thought experiment can help explore these questions: we’ll think simply about rotating between growth and value as a means of outperforming the S&P 500®. For the 10 years ending in December 2022, the S&P 500’s total return was 12.6%, while the S&P 500 Growth and S&P 500 Value indices returned 13.6% and 10.9%, respectively. Since Growth and Value combined compose the S&P 500, Exhibit 1 is unsurprising.
Suppose, arguendo, that an investor shifts annually to the style he predicts will outperform. The limits on such an investor’s performance are shown in Exhibit 2.
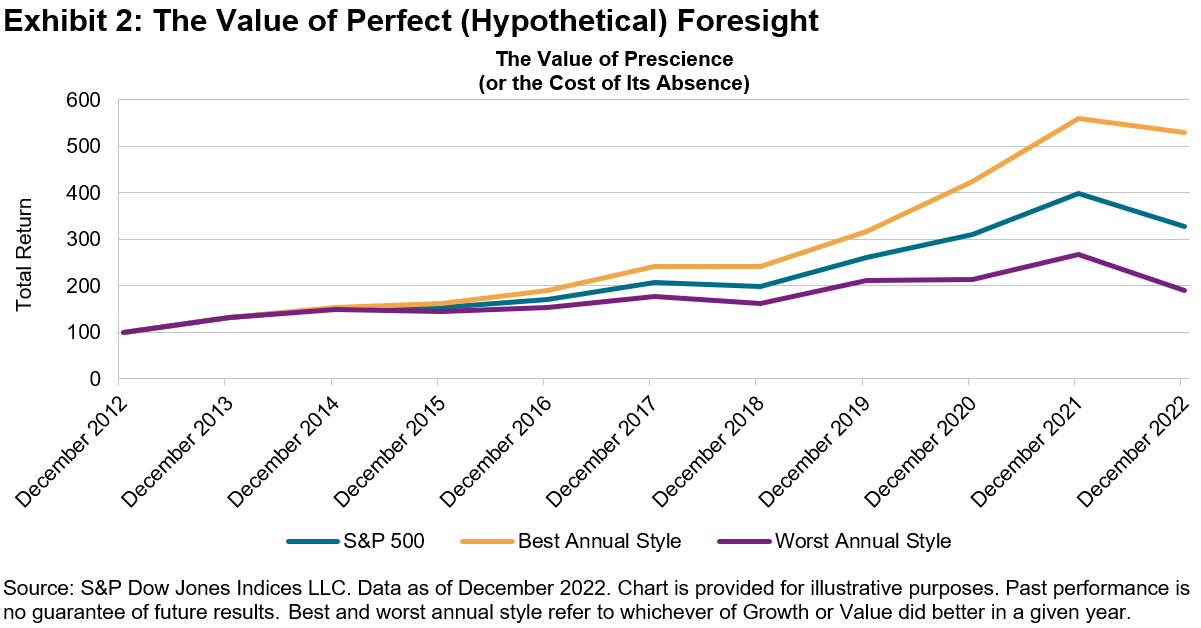
An investor who was correct every year would hypothetically earn a compound return of 18.2% for the period; if he was wrong every year the CAGR would fall to 6.6%.
Of course, it’s unlikely that anyone trying this strategy in real life would be correct—or incorrect—every year. Exhibit 3 shows how the return to a tactical rotational strategy would vary depending on the probability of making the correct call. With a probability of 0.1, e.g., at the beginning of every year, the investor would have a 10% likelihood of choosing the better performer and a 90% likelihood of choosing the worse performer.
(Click on image to enlarge)
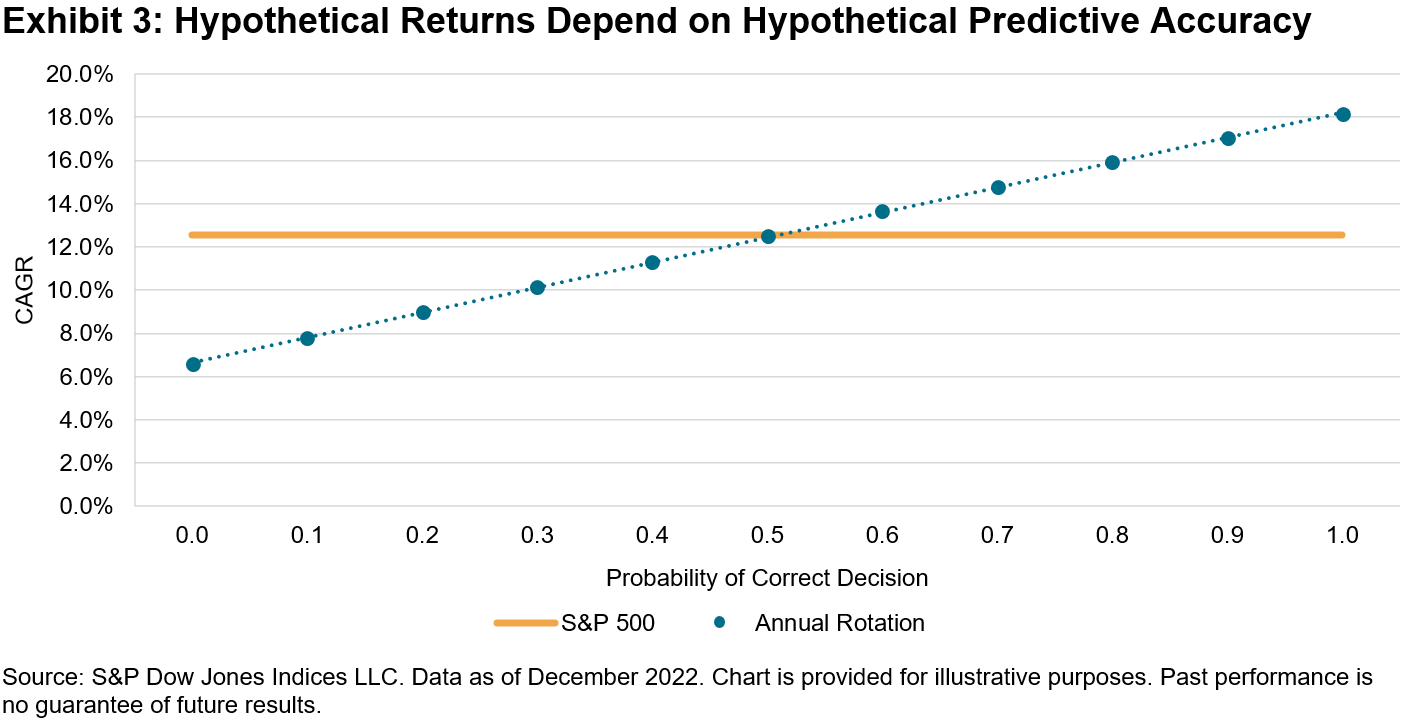
If every decision were right (probability = 1.0), the investor’s CAGR would be 18.2%; if every decision were wrong (probability = 0.0), it would be 6.6%. What’s interesting is to observe what happens between those limits, as summarized in Exhibit 4.
(Click on image to enlarge)
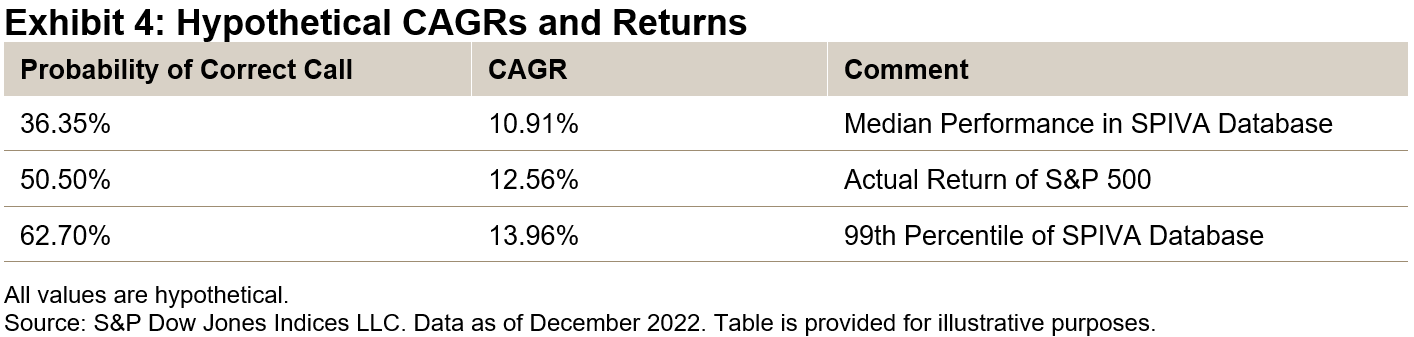
From these observations we can make some inferences about the prospects for successful style rotation:
- The performance of the median large-cap U.S. equity manager in our SPIVA® database is consistent with a 36.35% probability of making the right style call—-i.e., worse than a coin flip.
- Flipping a coin would have produced approximately the return of the S&P 500, which would have meant a top-quartile ranking for a large-cap U.S. equity manager. But if flipping a coin is the best you can do, it’s better not to bother and just track the S&P 500.
- Predictive accuracy levels above 63% would have produced returns that no manager actually produced, which implies that no active manager had that level of predictive accuracy.
Passive investors can be comfortable in their agnosticism.
More By This Author:
Hedging Debt Ceiling Drama With The S&P GSCI SOFR And S&P GSCI GoldCutting Carbon Without Changing Course: Net Zero Fixed Income Indices
Persistently Disappointing


Comments
Log in or sign up to join the conversation.