
A Smarter Way To Trade Volatile Markets

Image Source: Pixabay
Markets remain chaotic. On the surface, they may look bullish. But beneath that, sentiment is split, and every day seems to bring a new headline that can push prices sharply higher or lower. We are living through what feels like an age of chaos, where news cycles move faster than fundamentals.
History reminds us this isn’t new. In the 1930s, John Maynard Keynes described markets as a “beauty contest” where investors try to guess not what they themselves like, but what they think the crowd will like. That crowd can turn on a dime, whether it’s 1987’s crash, the dot-com bubble, or the pandemic bear market. In every era, emotions drive price swings long before fundamentals catch up.
That’s the problem I set out to solve more than a decade ago. I knew emotions move markets, but I wanted to quantify them. In my Charles H. Dow Award, winning paper, I introduced a volatility-based indicator that does exactly that. Instead of relying on what investors say—in surveys or headlines, I measure what they do through market action. Actions speak louder than words, and in markets, money speaks loudest of all.
The indicator is simple in principle. Unusual volatility is often the fingerprint of unusual opportunity. When fear dominates, volatility spikes. When greed takes hold, volatility contracts. By measuring these shifts, we can see when investors are positioned too far in one direction, and when the turn is likely.
On the chart below, the blue line shows my volatility measure. The Bollinger Bands (set at 2.1 standard deviations to reflect volatility’s different behavior from price) provide the frame. When the blue line dips below the lower band and then rises back above it, we have a buy signal. That’s not theory, it’s proven by data.
(Click on image to enlarge)
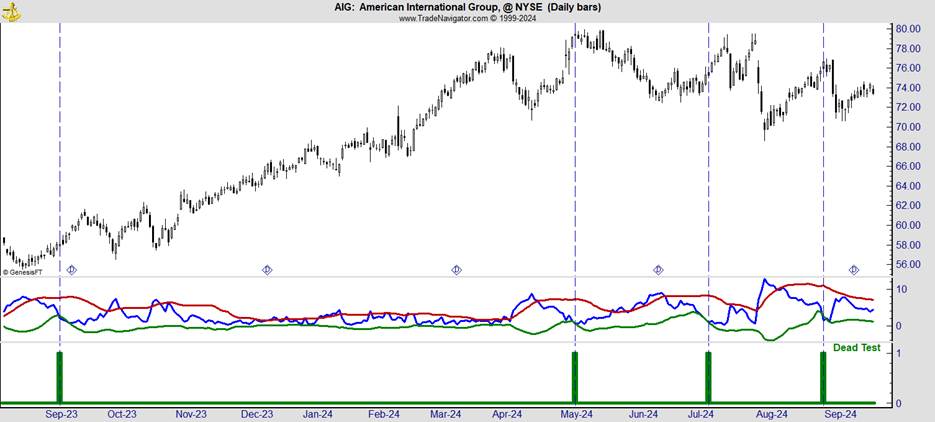
In back tests on S&P 500 stocks, this method delivered an average gain of 2.87% in just eight weeks. On Nasdaq 100 stocks, the win rate was 61.4% with an average gain of 3.6%. These aren’t outsized moonshots, but they compound quickly. Albert Einstein supposedly called compounding the “eighth wonder of the world.” Whether or not he said it, the truth holds: steady, repeatable gains add up.
Of course, no system is perfect. Not every trade is a winner, and not every signal is perfectly timed. That’s why I layer discipline on top of the indicator.
- Time-based exits: Each stock trends differently, but history shows most runs fizzle after a set period. We use that as our clock.
- Volatility-based stops: If a trade moves against us beyond what’s “normal” for that stock, we step aside before losses spiral.
- Position caps: We never hold more than eight positions at once. This balance maximizes exposure to winners while containing risk.
In practice, this means we don’t chase every swing in the age of chaos. We don’t need to. By focusing on clear signals, we capture enough of the market’s emotional extremes to grow wealth steadily without gambling on every headline.
The old trader’s advice still rings true: “To know what everyone knows is to know nothing.” In a world where everyone is drowning in noise, our edge is clarity. My volatility indicator doesn’t predict the news, it measures the crowd’s reaction to it. That’s what makes it useful.
In chaotic markets, prediction is fragile. Process is durable. That’s why I trust the process.
More By This Author:
This One Chart Tells Us What 2025 Will Look LikeFOMO’s Role In Driving Gold Prices
Using Compounding To Overcome A Shortfall In Retirement Savings
Disclaimer: The information contained in this article is neither an offer nor a recommendation to buy or sell any security, options on equities, or cryptocurrency. Investors Alley Corp. and its ...
more

