
A Seasonal Look At Market's Headwinds
The Worst Six Months of the year (May-October) for 2022 commences on the heels of the worst start for the market since 1950, points out seasonal timing expert Jeffrey Hirsch, editor of Stock Trader's Almanac.
Given that April is historically the best month of the year this is not a great sign. When the S&P 500 is down year-to-date and down in April, it preceded a yearly loss 69.2% of the time with an average loss of 7.3%.
To top off the ominous seasonality readings, the current Best Six Months from the close of October are off 7.9% for DJIA and -10.\3% for S&P 500. In the words of the late, great market analyst Edson Gould (Findings & Forecasts, 1902-1987): “If the market does not rally, as it should during bullish seasonal periods, it is a sign that other forces are stronger and that when the seasonal period ends those forces will really have their say.”
Not only are we on the cusp of the Worst Six Months, we also have entered the Weak Spot of the 4-Year Presidential Election Cycle. We created the bar chart below to highlight this critical juncture of the 4-Year Cycle we have been discussing all year.
(Click on image to enlarge)
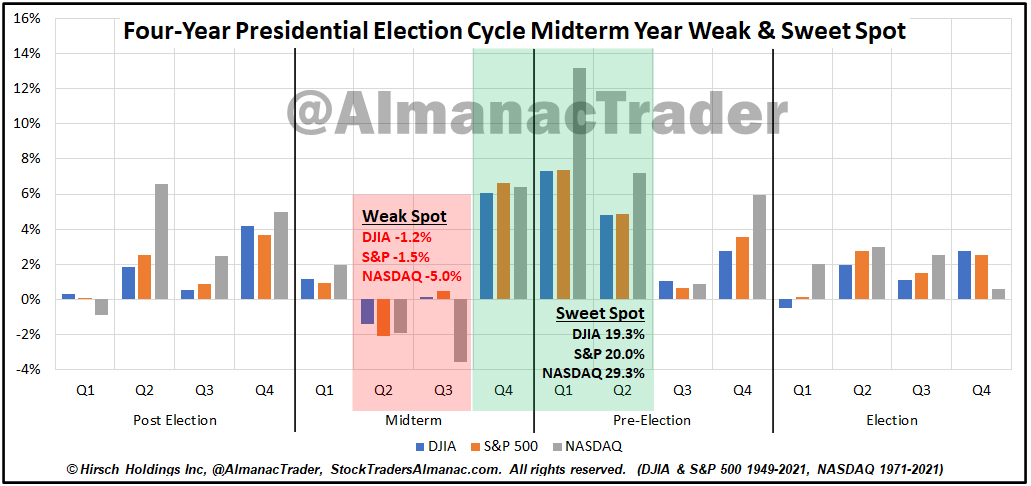
The second and third quarter of the midterm year has been the weakest period of the entire 4-year pattern averaging losses over the 2-quarter period of -1.2% DJIA, -1.5% S&P and -5.0% NASDAQ.
But thankfully, this sets up the even more important Sweet Spot of the cycle where DJIA gains 19.3%, S&P 20.0% and NASDAQ 29.3% over the three quarters from midterm year Q4 to pre-election year Q2.
(Click on image to enlarge)
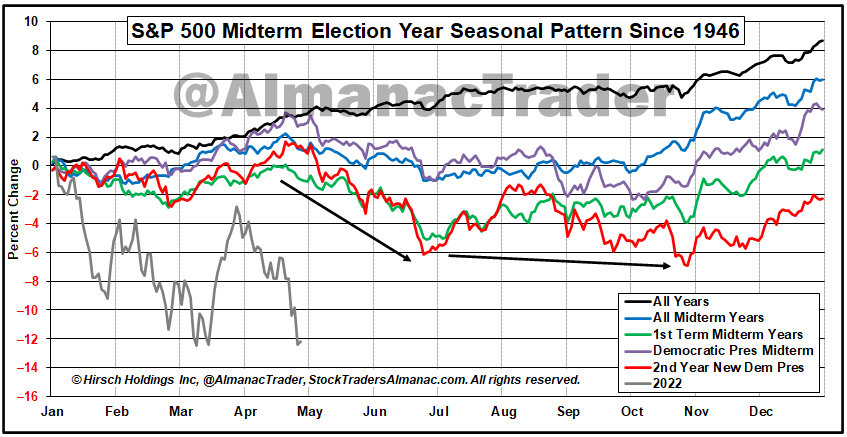
Our updated S&P 500 Midterm Year Seasonal Pattern reinforces this quadrennial buying opportunity as the market tends to find a midterm bottom over the next six months.
The graph above shows the “average” year, but it is important to note that these midterm bottoms have occurred at different times in individual midterm years and many of them came toward the beginning of the Weak Spot. The May 26, 1970 bear market low is a prime example.
(Click on image to enlarge)
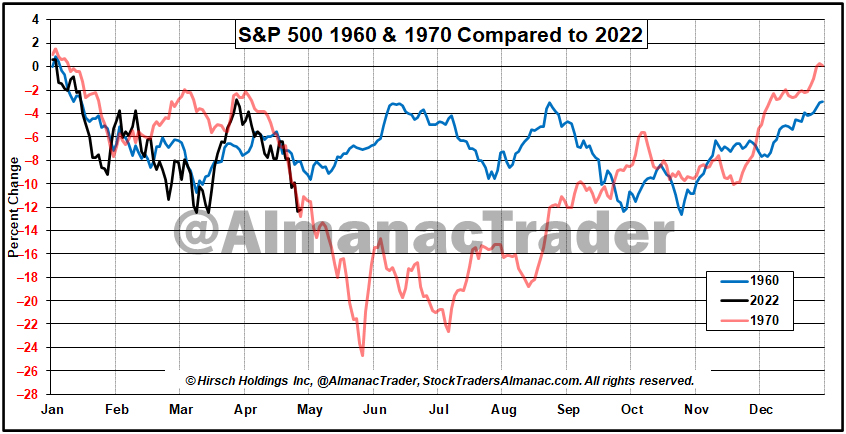
As you can see above in our graphic comparison of the years 1960 and 1970 to this year, 2022 is tracking eerily close to those two bear market years. Both 1960 and 1970 hosted recessions and rate increases in the prior year.
Inflation in 1970 was closer to current conditions with the CPI (Consumer Price Index) peaking around 6.5% year-over-year. It would be nice if 2022 played out more like 1960 with milder losses. Unfortunately, present circumstances are more akin to 1970. 1960 was also an election year, while1970 was a midterm year like 2022.
This time is a little different due to covid-disrupted supply chains and the fallout from Russia’s invasion of Ukraine with soaring energy and commodity prices. We are not implying the 36% bear market losses from the 1968 top to the 1970 bottom are in the cards, but we suspect that we have not found bottom just yet.
In short, the market currently faces a plethora of headwinds. We might get an early midterm bottom like 1970 or a milder more drawn-out bottoming process like 1960 and the average midterm year. Either way, fasten your seatbelts volatility is probably here for the next several months as the market searches for bottom.
Stay cautious, be patient and wait for the fatter pitch later in the Worst Six Months or for our next Best Six Months Buy Signal sometime on or after October 1. We expect continued heightened volatility in the face of midterm year and seasonal pressures, supply chain issues, inflation, and rate hikes.
Disclaimer: © 2022 MoneyShow.com, LLC. All Rights Reserved.


