
A Scary Chart
This is scary…
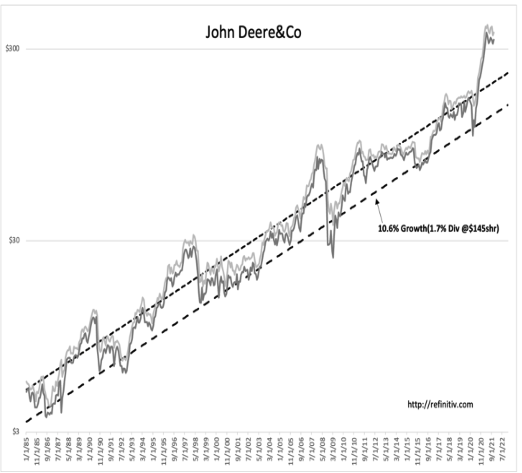
People can debate all day the vacations of tech stocks. The growth of them can happen parabolically and new product lines can create whole new industries and unexpected revenue streams. But, when it comes to 100 yr old industrials, it becomes a bit difficult to argue for a specific reason they should be valued at 2X to 3X their historical valuations. When you look at the chart, the last time DE was at these levels was in 1998 and 2000. This reminds me of KO trading last 80X earnings before the tech bubble exploded.
The thing about momentum is that it changes faster to the downside than the slow climb up. Be careful. Things are getting bit stretched in certain sectors.
“Davidson” submits:
DE highest valuations ever-no change in historical margins or revenue growth-shows impact of Momentum Investing. I use Pr/Sales as a financial metric because it is the most fundamental measure of the direction of stock prices if all other business metrics following historic levels. I buy when Pr/Sales is historically low as I did in 2016. But, I also sell when market psychology pushes Pr/Sales rises to extremes and did so in 2018 after 100% gain.
Recent pricing of 2.6x Revenue is well above prior high periods of 1.6x. Such is Momentum! I do not own DE, but hold many issues at 30% historical levels Pr/Sales that I believe will produce several years of reports that make Momentum Investors drool. If I am right, the next 3yrs-5yrs should prove beneficial.
Disclaimer: The information in this blog post represents my own opinions and does not contain a recommendation for any particular security or investment. I or my affiliates may hold positions or ...
more

