A Dividend Portfolio That Can Outperform The Market By A Big Margin
I was looking for a formula to create a large-cap dividend stocks portfolio that can outperform the market by a significant margin on the long run. After many trials, I have found out that a portfolio of twenty S&P 500 companies yielding more than 2% a year and having the highest Research and Development Expense to Revenue ratio is giving excellent results.
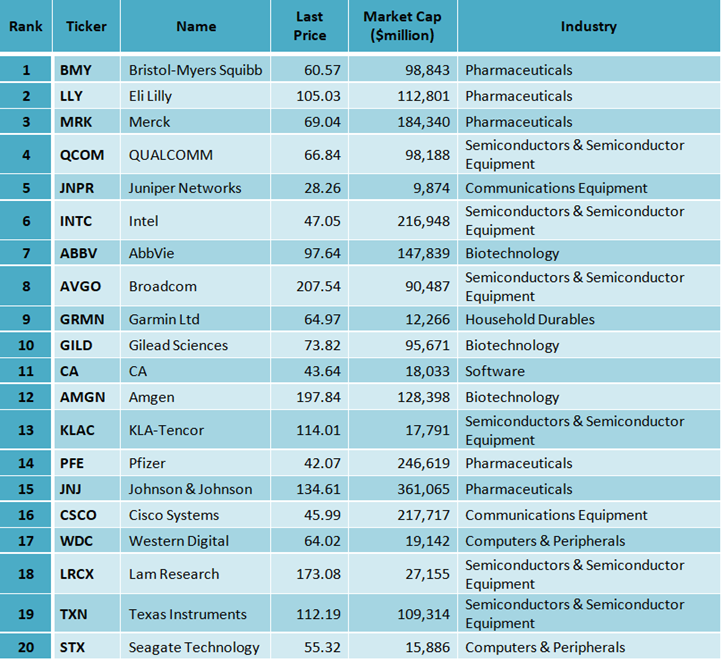
After running this screen on August 23, 2018, I discovered the following twenty stocks, which are shown in tables below.
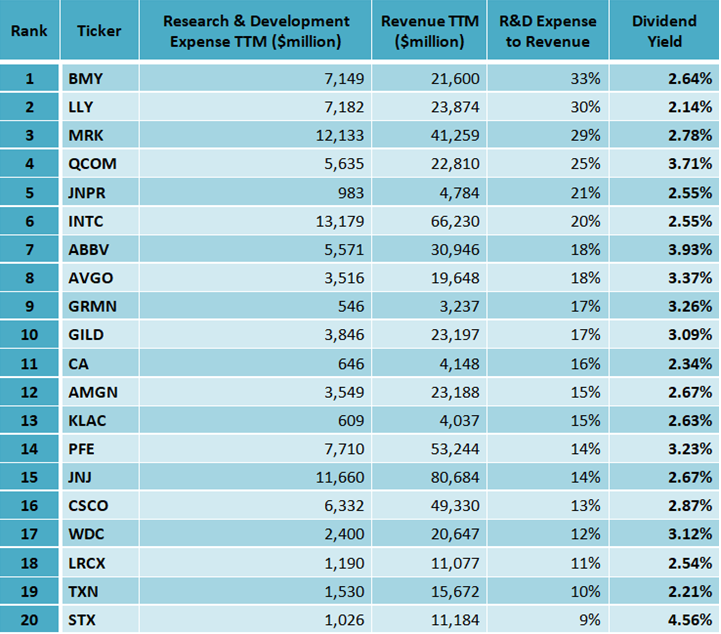
The table below presents the Research & Development Expense at the trailing twelve months (TTM), the Revenue TTM and the R&D to Revenue ratio, for the twenty companies.
Back-testing
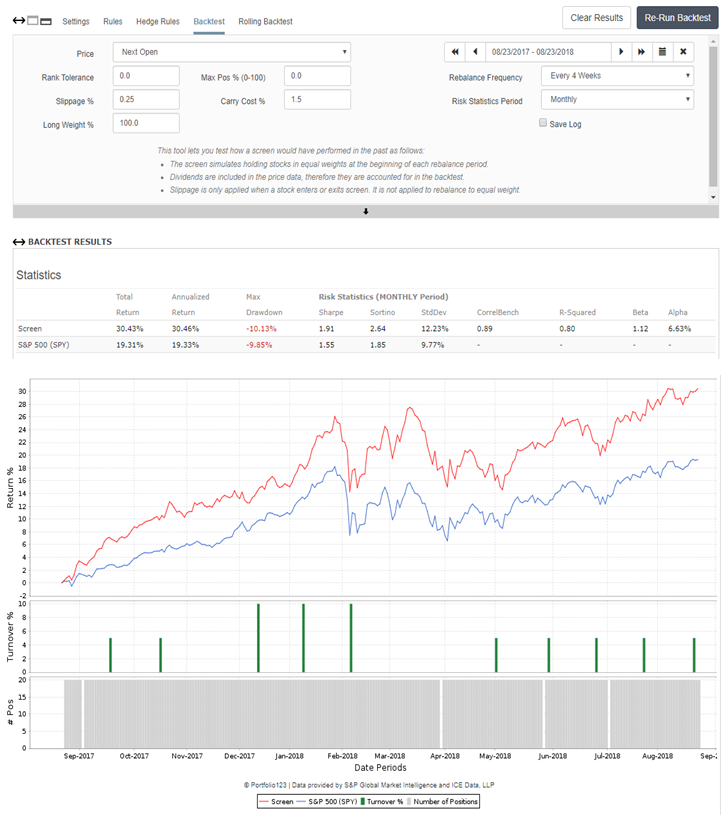
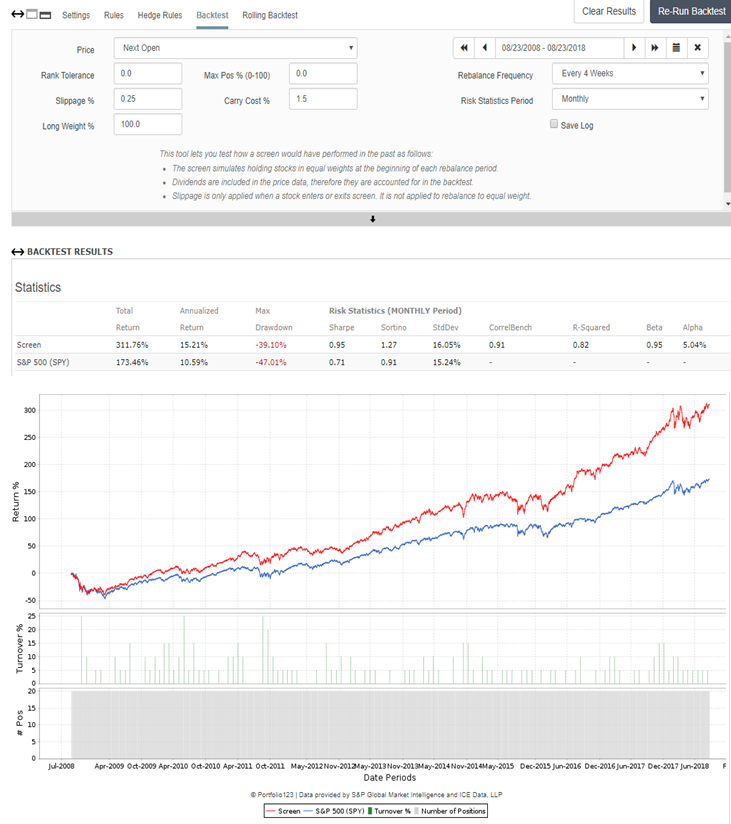
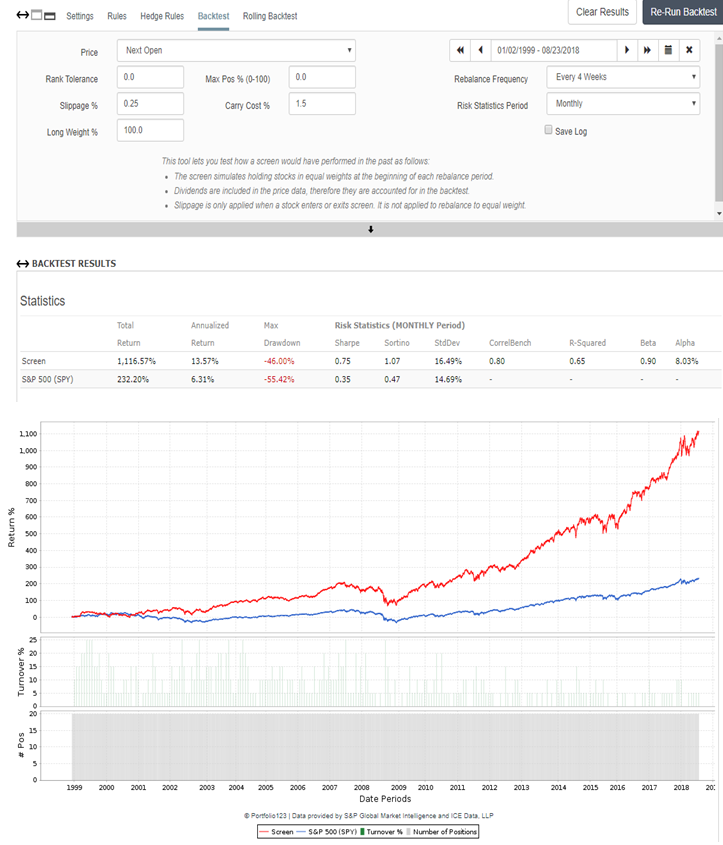
The back-test takes into account that you need to be running the screen every four weeks and replacing the stocks that no longer comply with the screening requirement with other stocks that meet with the demand. The theoretical return is calculated in comparison to the benchmark (S&P 500), considering a 0.25% slippage for each trade and 1.5% annual carry cost (broker cost).
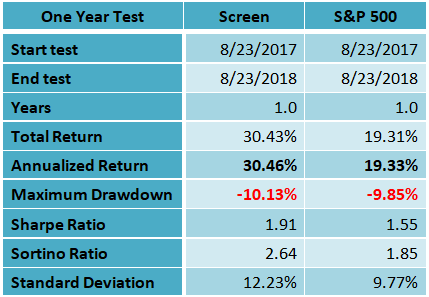
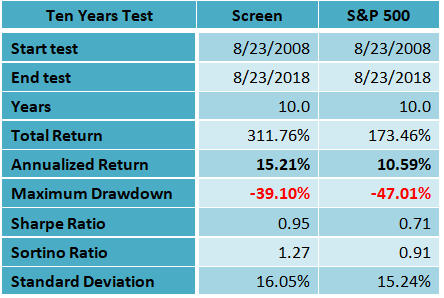
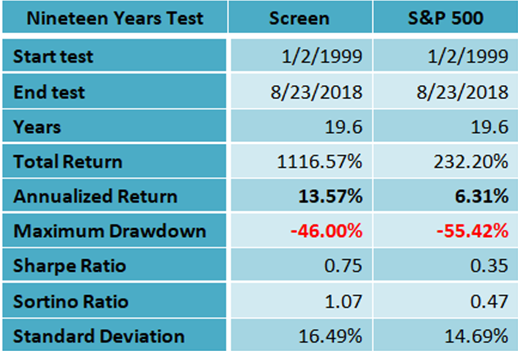
The back-tests results are shown in the charts and the tables below.
One year back-test
(Click on image to enlarge)
Ten years back-test
(Click on image to enlarge)
Nineteen years back-test
(Click on image to enlarge)
Summary
The dividend stocks screen based on the highest Research and Development Expense to Revenue ratio has given much better returns during the last year, the last ten years and the last nineteen years than the S&P 500 benchmark. The Sharpe ratio, which measures the ratio of reward to risk, was also much better in all the three tests.
The one year return of the dividend screen was at 30.43%, while the return of the S&P 500 index during the same period was at 19.31%. The difference between the dividend screen to the benchmark was even more noticeable in the nineteen years back-test. The nineteen years average annual return of the screen was at 13.57%, while the average annual return of the S&P 500 index during the same period was only 6.31%. The maximum drawdown of the screen was only 46.0%, while that of the S&P 500 was at 55.42%.
Disclosure: I am long QCOM, AMGN, GILD and LRCX.


Impressive!
Thanks!