

Image Source: Pixabay
The Trade Desk (TTD) is a technology company that helps businesses buy digital ads in a smarter, more automated way. They operate a self-service platform where advertisers can run campaigns across websites, apps, streaming TV, and more.
Instead of relying on walled gardens like Google or Facebook, The Trade Desk focuses on the open internet, giving advertisers more transparency and control. The company makes money by taking a small cut of the advertising spend that flows through its platform.
Founded in 2009, The Trade Desk is now one of the largest independent ad tech companies. In July 2025, it was added to the S&P 500 index, putting it on the radar of even more investors.
The IDDA Analysis framework is used to analyze companies and determine which are right for you. There are five steps to the process:
- Capital Analysis – Your personal risk tolerance.
- Intentional Analysis – Your unique financial goals and timelines based on your age, health, and lifestyle.
- Fundamental Analysis – The viability of the asset based on company performance, financial health, and market position.
- Sentimental Analysis – The current emotions of Wall Street and other market participants.
- Technical Analysis – Historical price action to identify key psychological levels and market patterns.
Let’s dive into the IDDA analysis to assess The Trade Desk’s fundamental, sentimental, and technical outlook.
IDDA Point 1&2: Capital & Intentional
The capital and intentional analysis need to be conducted by you.
Select your assets in alignment with your financial goals. Listen to your intuition about each asset, but remember to invest based on your own values, not just because of recommendations from others.
IDDA Point 3: Fundamental
Revenue growth remains strong
The Trade Desk reported first quarter 2025 revenue of 616 million which was up 25 percent from last year. For the second quarter, they guided for 682 million which would be 17 percent growth. Growth is slowing a bit but remains double digits while many ad tech peers are struggling.
Expanding margins show improved profitability
Adjusted EBITDA (earnings before interest, taxes, depreciation, and amortization) margins increased to 34 percent in the first quarter and are projected to hit 38 percent in the second quarter. This shows better cost control even with rising operational expenses from new projects.
Huge buybacks signal management confidence
The Trade Desk spent 386 million on buybacks in the first quarter and still has 631 million left in its repurchase program. They are also debt free with over 1.7 billion in cash which gives them more flexibility.
Product innovation driving future growth
New launches like Deal Desk, OpenPath, Ventura OS, and Kokai AI are attracting more clients. Early data shows Kokai cuts advertiser costs by up to 40 percent making the platform more attractive.
Growth is slowing compared to previous years
Revenue growth has decelerated from 25 percent in the first quarter to 17 percent guidance for the second quarter. The company also saw a rare revenue miss in the fourth quarter of 2024 which shook investor confidence and caused the stock to drop.
Valuation is expensive
The Trade Desk trades at around 14 times sales and over 50 times free cash flow. It remains one of the pricier stocks in the market which makes it vulnerable to big corrections during market downturns.
Fundamental risk: medium
The Trade Desk remains a strong company with leadership in open internet advertising. However, its high valuation and slowing growth create some medium-term risks especially if new product rollouts underperform.
IDDA Point 4: Sentimental
Overall sentiment is cautiously bullish for The Trade Desk. Investors are optimistic after the S&P 500 inclusion and positive earnings guidance but remain aware of macroeconomic pressures and valuation concerns.
Strengths
S&P 500 inclusion has created a positive narrative around The Trade Desk, boosting visibility and drawing in institutional investors through index funds.
CEO Jeff Green remains outspoken about the company’s mission to defend the open internet and push back against big tech walled gardens. This resonates with investors looking for alternatives to Google and Amazon dominance.
Strong adoption of Kokai AI and new tools like Deal Desk give investors confidence in long-term innovation. Early reports show these products reduce advertiser costs and improve performance.
Regulatory actions against Google and Apple are shifting attention to open-web platforms like The Trade Desk, which is seen as a more transparent option in the digital ad world.
Analysts from Wedbush and KeyCorp have raised price targets and earnings estimates after the latest guidance, supporting a generally positive market tone.
Risks
Short-term investor excitement could lead to profit taking after the S&P 500 inclusion rally. The stock already jumped after the announcement.
Recent Q4 2024 revenue miss showed that The Trade Desk is not immune to macro pressures. This has made some investors nervous about future earnings surprises.
Broader ad spend slowdown in 2025 has created caution in the market, with many advertisers cutting budgets in uncertain economic conditions.
High valuation remains a sticking point for many investors. Some analysts warn that the stock could see sharp corrections during market downturns due to premium pricing.
Competitive pressures from Amazon, Google, and even retail media newcomers could limit upside potential especially if new initiatives like Ventura OS fail to gain traction.
Sentimental risk: medium
Investors like the long-term story around The Trade Desk but are wary of short-term bumps from macroeconomic conditions, competition, and rich valuation.
IDDA POINT 5 – TECHNICAL
Monthly Chart
The overall trend is positive on the monthly chart and the Ichimoku Cloud is bullish.
The stock experienced two major pullbacks. The first was in 2022 when it retraced to its 78 percent Fibonacci retracement level.
The second pullback happened in the first four months of 2025 when it retraced 100 percent from the Fibonacci retracement levels.
Since its latest bottom in April 2025 at 43 dollars, the stock has gained 86 percent and has grown for three consecutive months.

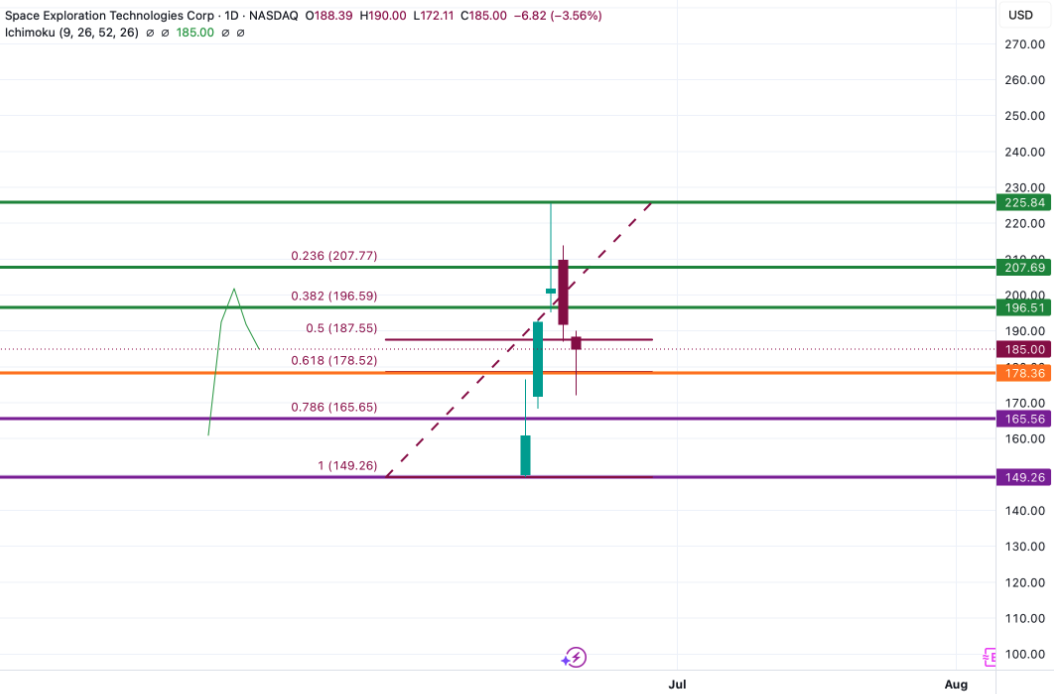
Weekly Chart
The weekly chart shows bearish signals. The Ichimoku Cloud is red.
The conversion line is below the baseline which is a bearish crossover.
The lagging span is below the cloud and current candles are also below the cloud.
The RSI is around 60 which leaves room for upside but also suggests it could face resistance before another pullback.
The stock remains about 43 percent lower than its all-time high.
The technical outlook shows mixed signals. The long-term trend remains positive but the weekly chart shows short-term weakness. It could continue to recover after the recent rally but investors should watch for pullbacks especially if it fails to break above the weekly cloud.
This stock is suitable for both long-term investors and swing traders.
(Click on image to enlarge)
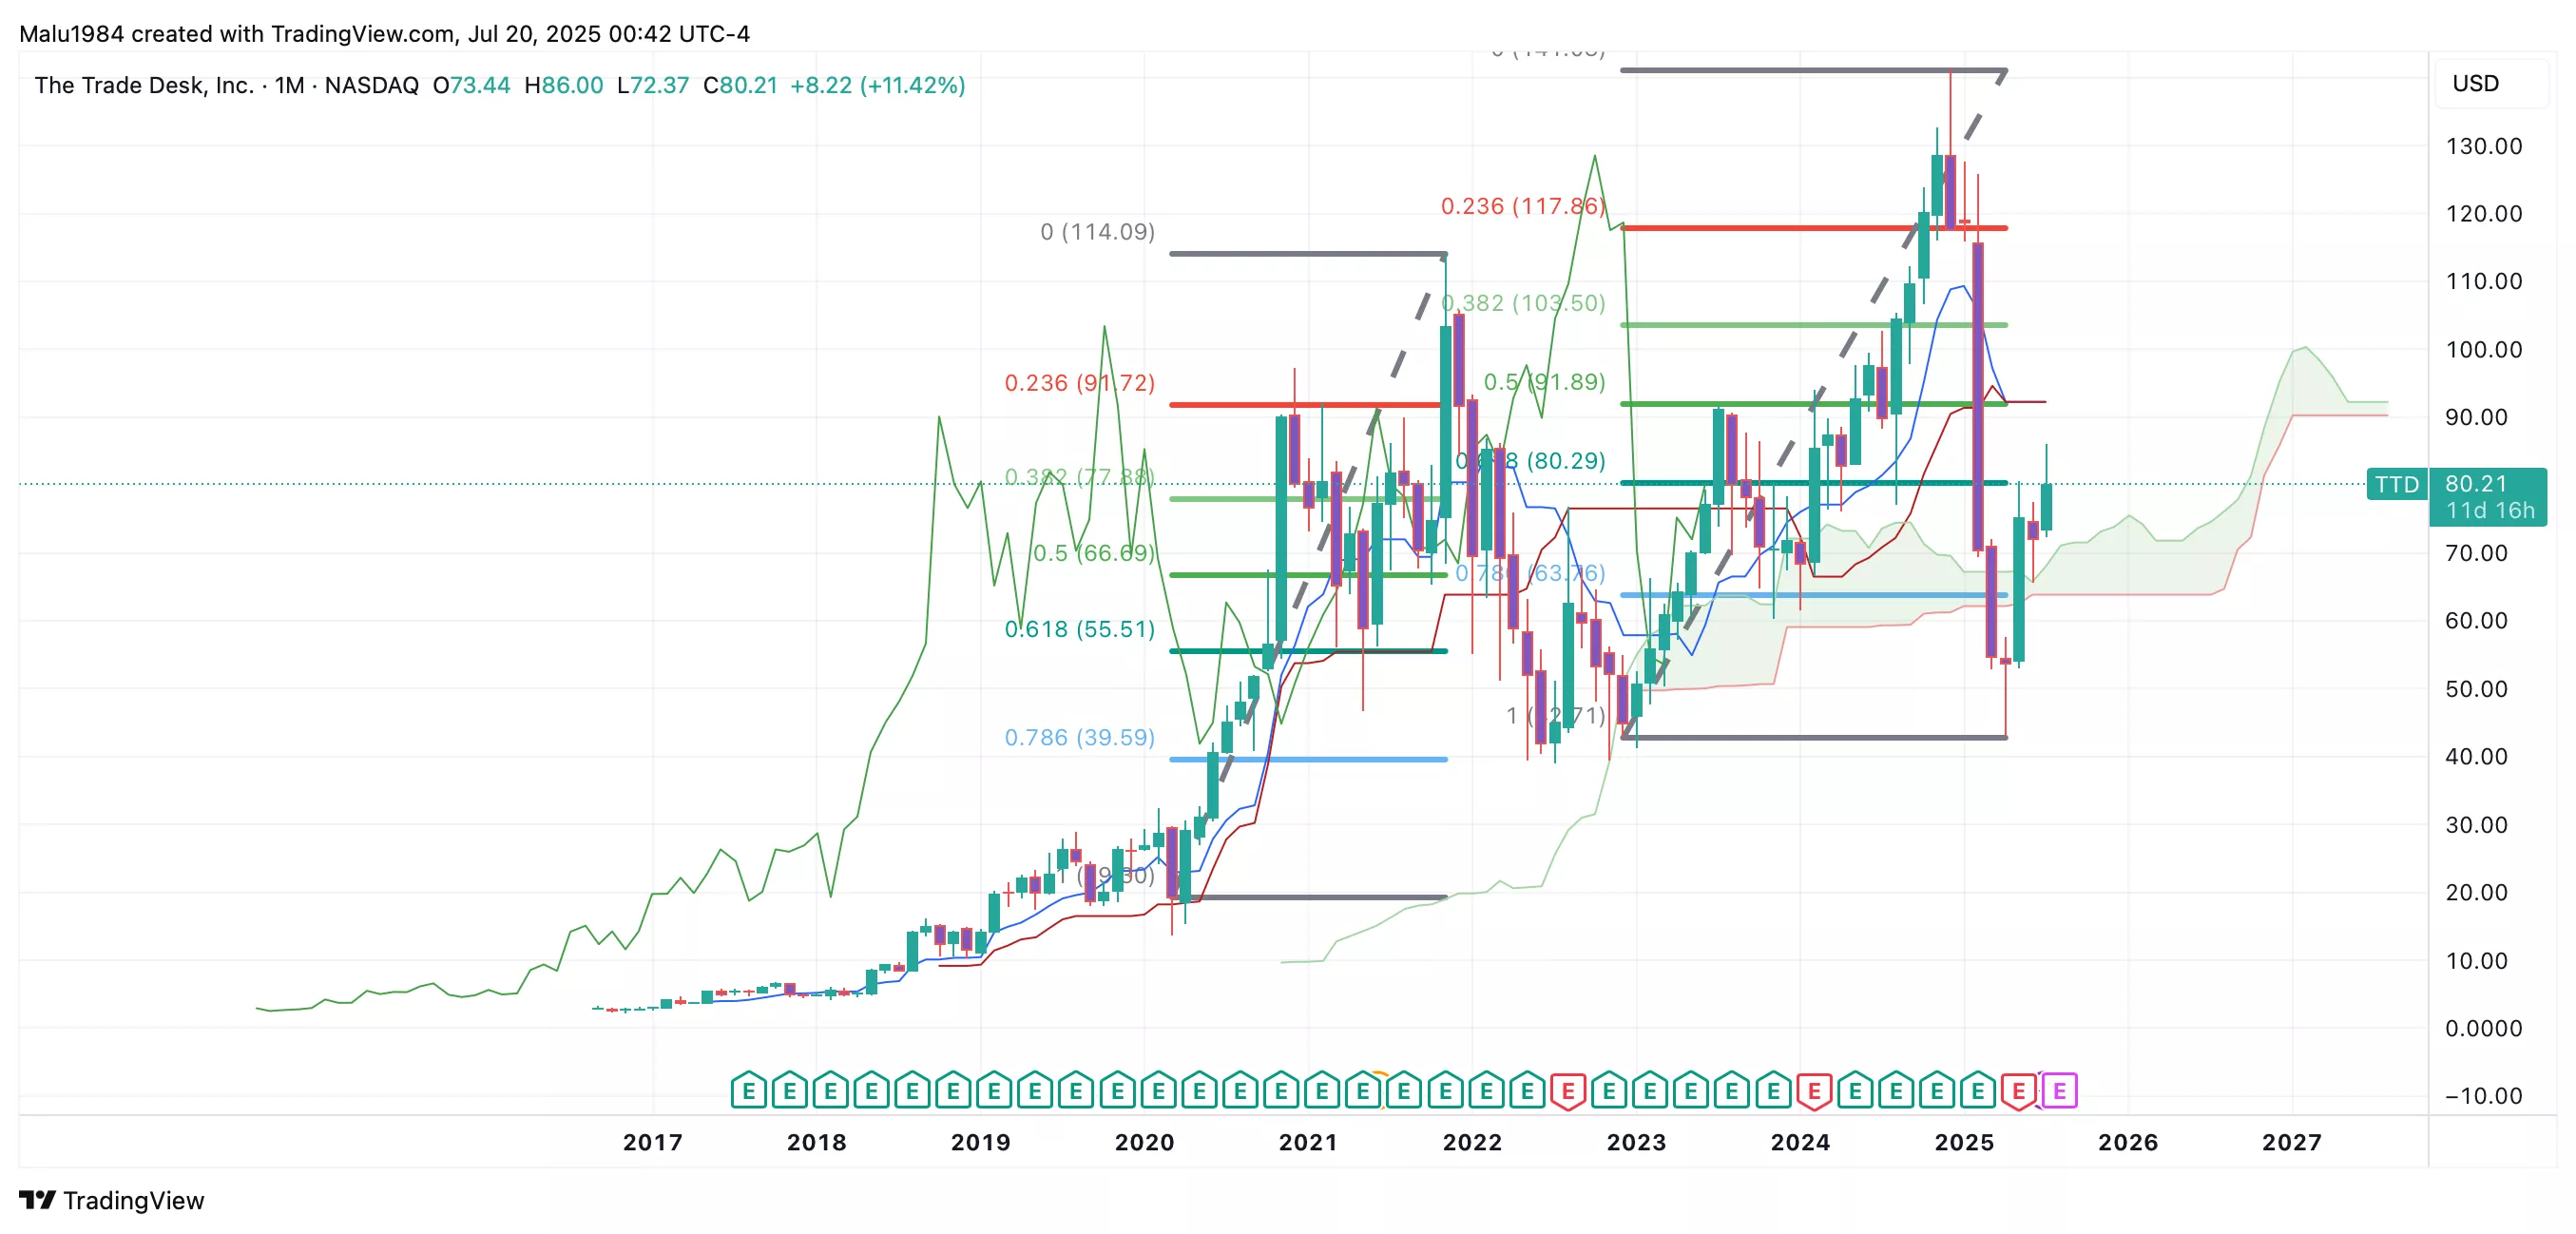
Buy Limit (BL) levels:
$76.01 – High Risk
$69.89 – Moderate Risk
$65.12 – Low Risk
Profit Taking (PT) levels:
$91.94 – High Risk
$103.73 – Moderate Risk
$117.96 – Low Risk
Here are the Invest Diva ‘Confidence Compass’ questions to ask yourself before buying at each level:
- If I buy at this price and the price drops by another 50%, how would I feel? Would I panic, or would I buy more to dollar-cost average at lower prices? (hint: this question also reveals your CONFIDENCE in the asset you’re planning to invest in).
- If I don’t buy at this price and the stock suddenly turns around and starts going up again, will I beat myself up for not having bought at this level?
Remember: Investing is personal, and what is right for me might not be right for you. Always do your own due diligence. You should ONLY invest based on your own risk tolerance and your timeframe for reaching your portfolio goals
Technical risk: medium to high
The monthly chart shows a strong recovery with bullish long-term signals but the weekly chart remains bearish with several warning signs. The stock is still far from its all-time high and could face more short-term pullbacks before resuming a longer uptrend. This creates a medium to high technical risk for short-term traders while long-term investors may see more stability.
Summary: Final Thoughts
The Trade Desk is showing solid long-term potential after its inclusion in the S&P 500. Fundamentals remain strong with steady revenue growth, rising margins, a clean balance sheet, and new product launches like Kokai AI and Deal Desk driving future opportunities.
The company is actively expanding into connected TV and retail media which could unlock more growth.
Sentimental analysis shows a cautiously bullish tone. Investors are optimistic after the S&P 500 news and product updates but remain alert to short-term risks.
High valuation and recent earnings volatility keep some investors on edge. CEO comments and regulatory tailwinds support a positive narrative for open internet advertising.
The technical picture is mixed. Long-term charts remain bullish but weekly signals point to short-term weakness. The stock is still far from its all-time high and may see more corrections before continuing its uptrend.
Overall, The Trade Desk looks like a solid long-term hold for growth-focused investors who can handle price swings. The company is well-positioned for future digital advertising trends but high valuation and market volatility increase short-term risk.
Overall risk: medium
More By This Author:
Slow Growth And Sell Offs: Is Coca-Cola Stock Still Worth Holding In 2025?Is American Express Stock: 5 Things Investors Might Be Missing In 2025
Forget Nvidia? Why Savvy Investors Are Quietly Buying TSM Stock Right Now

Comments
Log in or sign up to join the conversation.