
5 Large Caps For Momentum Investors - June 7, 2016
Today I used Barchart to sort the S&P 500 Large Cap Index stocks to find the ones with the best upside momentum. First I sorted for the most frequent new highs in the last month and then again for technical buy signals of 80% or more. Next I always use the Flipchart feature to review the charts for consistency.
Today's watch list includes: Nvidia (Nasdaq: NVDA), Tyco International (NYSE: TYC), Patterson (Nasdaq: PDCO), Texas Instruments (Nasdaq: TXN) and Hewlett-Packard (HPQ)
Nvidia
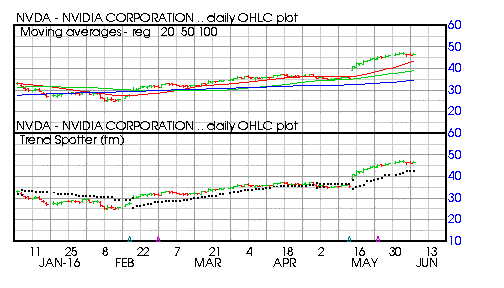
Barchart technical indicators:
- 96% technical buy signals
- Trend Spotter buy signal
- Above its 20, 50 and 100 day moving averages
- 16 new highs and up 32.20% in the last month
- Relative Strength Index 78.29%
- Technical support level at 45.44
- Recently traded at 46.72 with a 50 day moving average of 39.02
Tyco International
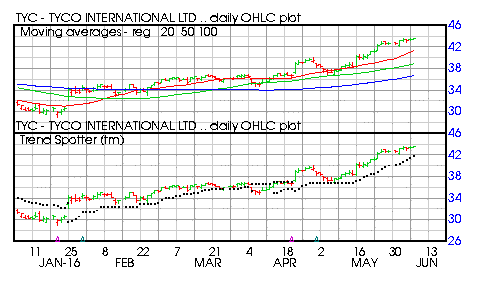
Barchart technical indicators:
- 96% technical buy signals
- Trend Spotter buy signal
- Above its 20, 50 and 100 day moving averages
- 16 new highs and up 15.56% in the last month
- Relative Strength Index 79.61%
- Technical support level at 42.89
- Recently traded at 43.50 with a 50 day moving average of 38.87
Patterson
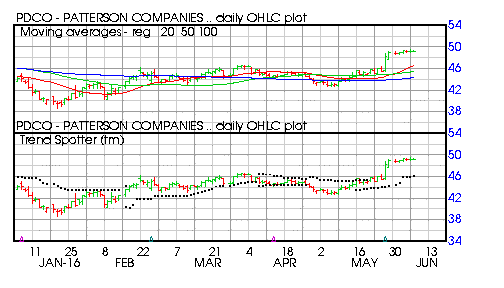
Barchart technical indicators:
- 96% technical buy signals
- Trend Spotter buy signal
- Above its 20, 50 and 100 day moving averages
- 15 new highs and up 14.47% in the last month
- Relative Strength Index 71.42%
- Technical support level at 48.84
- Recently traded at 49.30 with a 50 day moving average of 45.44
Texas Instruments
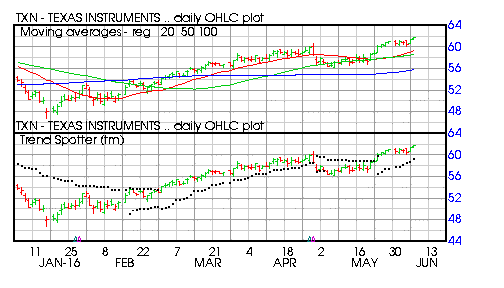
Barchart technical indicators:
- 96% technical buy signals
- Trend Spotter buy signal
- Above its 20, 50 and 100 day moving averages
- 15 new highs and up 7.83% in the last month
- Relative Strength Index 67.06%
- Technical support level at 60.18
- Recently traded at 61.65 with a 50 day moving average of 58.59
Hewlett-Packard
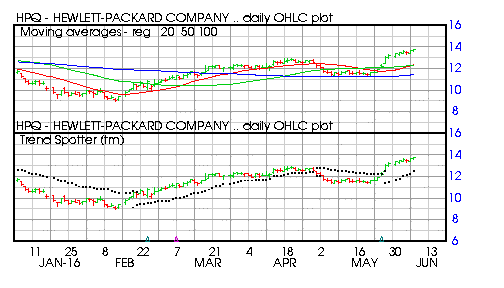
Barchart technical indicators:
- 96% technical buy signals
- Trend Spotter buy signal
- Above its 20, 50 and 100 day moving averages
- 14 new highs and up 18.64% in the last month
- Relative Strength Index 76.54%
- Technical support level at 13.33
- Recently traded at 13.73 with a 50 day moving average of 12.31
Disclosure: None.
How did you like this article? Let us know so we can better customize your reading experience.

Comments
Leave a comment to automatically be entered into
our contest to win a free Echo Show.

