
FedEx’s latest preliminary earnings release sent the stock down 21.4% on Friday, September 16th as management withdrew their forecast on worsening business conditions. The news of forecasts being pulled at FedEx helped send the broad S&P down 0.72% because FedEx is a key company in the transportation industry and a component of the Dow Jones Transportation Average which is watched as a leading indicator for the economy and business cycle.
This article will discuss three leading indicators for the economy Dow Theory and watching the Dow Jones Transportation Average, analyzing inventory-to-sales ratios across critical businesses, as well as monitoring inflation coming through the supply chain as seen by purchase manager indices. All three leading indicators are currently pointing toward a coming slowdown in the economy as the current market data in this article will show. Along with recent market data, we will walk through a current example with Walmart and Target, calculating their inventory-to-sales ratio over the past 5 years.
1) Shipping and Transportation Sector – Dow Theory
The Dow Jones Industrial Average (DJIA) was created by Charles Dow in 1884 to track the industrial performance of the economy. In the initial days of the DJIA, there were 9 railroad companies and 2 non-railroad companies. The DJIA has grown from its initial 11 companies to now include 30 companies with names as diverse as Microsoft, Walgreens, and Nike.
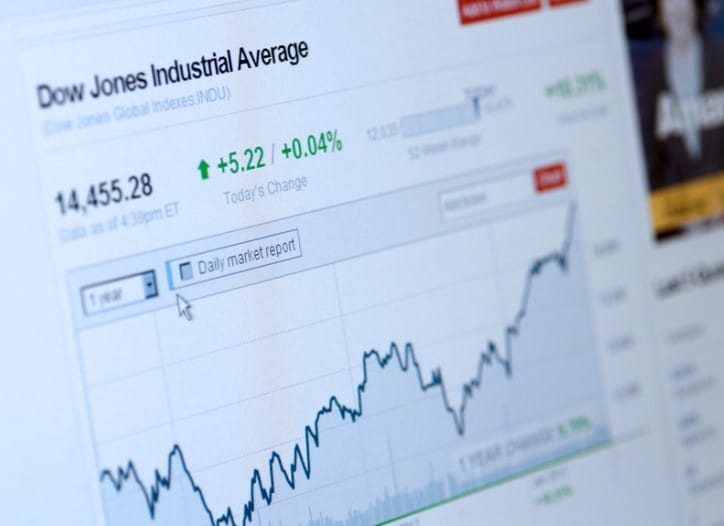
While these new consumer and technology businesses are crucial to the performance of the economy, the price-weighted focus of the index means transportation companies are underrepresented compared to Charles Dow’s original index. This has led to offshoot indices such as the Dow Jones Transportation Average (DJTA) being distinguished. The DJTA, with its focus on transportation and shipping, is more relatable to the initial Dow Jones indices with the 9 railroad stocks and is arguably the older and original index.
The transportation sector acts as a leading indicator because it is further up the value chain involved in the procurement of goods for production compared to the more final products being sold by companies in the DJIA. FedEx is an important component of the DJTA and is one of the more common household names. The reduction in the forecast from the company not only sent FedEx’s shares down 21.4% but also led to a 5% fall in the Dow Jones Transportation Average. As can be seen in the graph below, the now underperformance of DJTA versus DJIA is a sign of a slowdown coming in the economy. The monitoring of the DJTA compared to the DJIA can be referred to as Dow Theory and there are a number of different moving averages that investors can watch for technical cues.
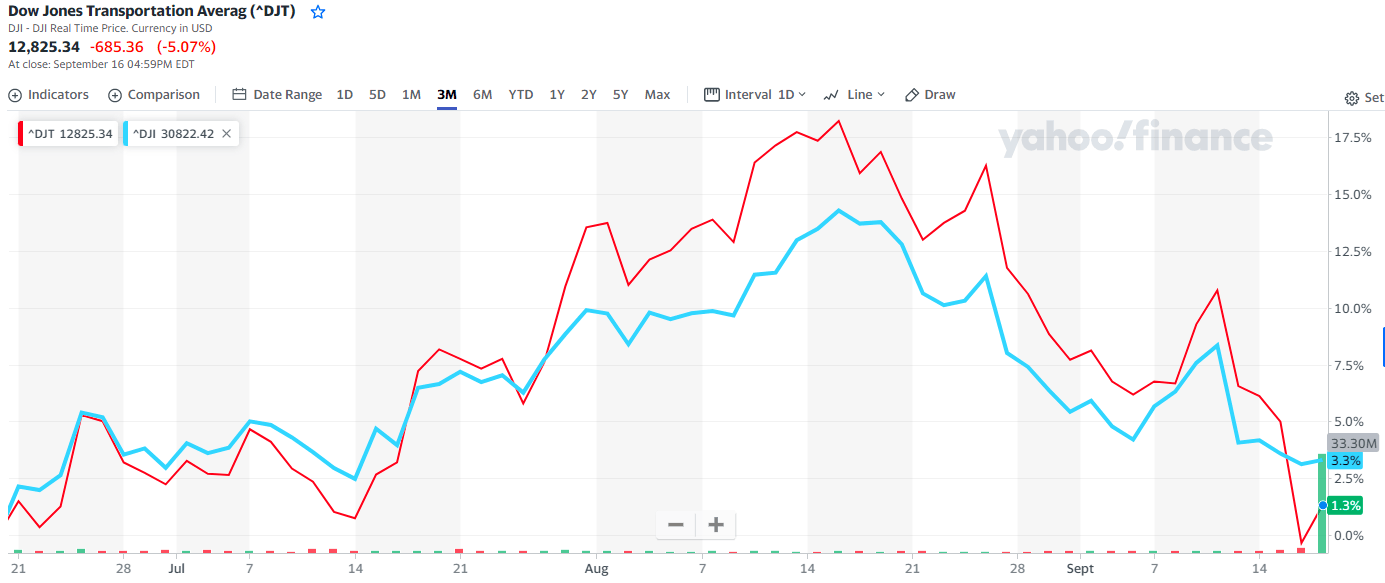
Sourced from Yahoo Finance
2) Inventory-to-Sales Ratios and GDP
The change in inventories at major retailers and manufacturers can be watched for early signs of what is going on in the economy. When inventory gets too high at a company, it can be an indicator that future quarters will likely see a decrease in production or inventory purchases as management looks to get the company back to an appropriate inventory level.
The inventory cycle is shorter than the business cycle and is said to last around 3 years compared to a business cycle averaging around 10 years. Changes in inventory levels are a key component of the gross domestic product (GDP) calculation and large changes are often associated with recessions having contributed up to 2% of GDP contraction in some previous recessions as outlined by the St. Louis Fed.
This excess inventory will need to be sold off and not replenished in order to get inventory levels back to their usual ratio to sales. The reduction in these inventory levels will ripple through GDP as the decreased production also has other negative effects, including the layoff of production workers and staff.
On the opposite side, decreasing inventory-to-sales ratios can be a positive sign of coming strength in the economy as businesses will be needing to restock inventory and staff up to meet production and demand needs.
Current Example with Walmart and Target
Keeping all this in mind, let’s take a look at retail giants Walmart and Target and their latest financials released for the quarter ending July 31st, 2022. As can be seen in the graph below, Target and Walmart’s inventory levels have crept up in recent years to 12.3% and 9.9%, respectively. Compared to their average level of 11.6% and 8.8%, the incremental 0.7% and 1.1% of inventories being held are starting to add up. Based on the trailing twelve-month revenues, this would imply inventory purchases of $6.8 billion need to be slowed down at Walmart and $0.7 billion at Target.
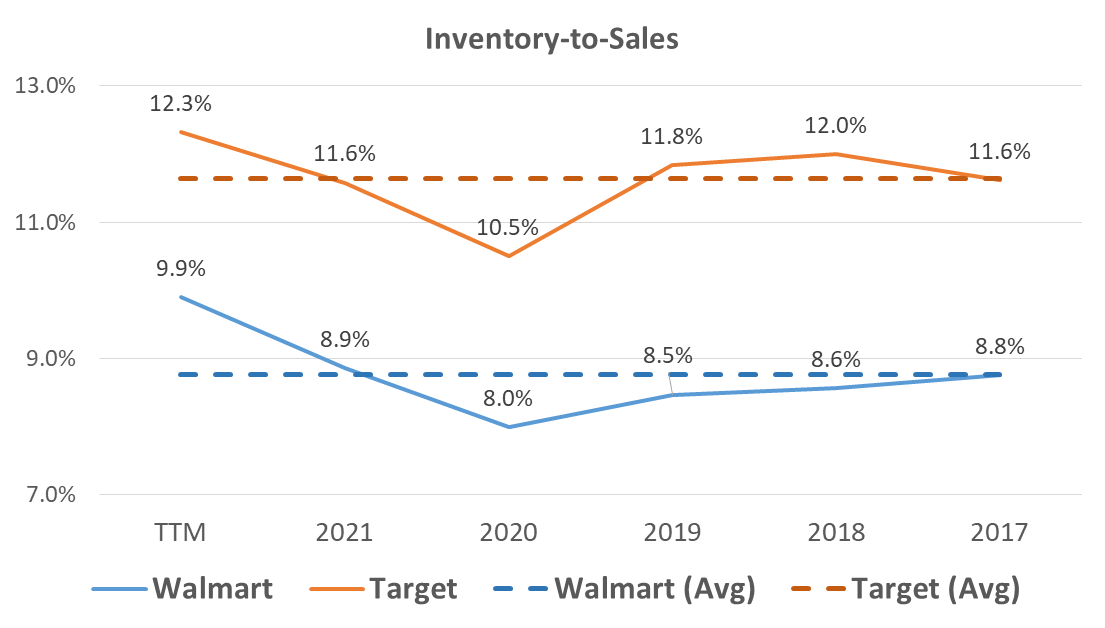
Sourced from Walmart and Target’s annual reports
In the example with these two retail giants, we can already see a total of $7.5 billion in inventory purchases that need to be held back in the quarters to come. This already sounds like a big number, but now imagine the thousands of businesses across the country that may be going through a similar inventory cycle. The U.S. had a GDP of $20.9 trillion in 2020 and as mentioned earlier, changes in inventories can have a big impact.
In our example, we have looked at two retailers but investors could also look at the inventory of manufacturers and other businesses higher up in the economic value chain to get an even better leading indicator.
3) Inflation Rates as a Leading Indicator
The rate of inflation is a response to slack in the economy and a decrease in the inflation rate is associated with an output gap and a weakening economy. Growing inflation signals a strong economy needing to raise prices in order to get demand filled. Watching for changing trends in inflation can help investors get a general sense of how the economy is performing. The earlier investors can sport those trends, the better.
The Purchase Managers Index (PMI) is one of the best leading indicators of the U.S. economy as it shows price increases (or decreases!) before they make their way along to the consumer. While current U.S. PMI readings of 52.8 for August 2022 are still over the 50 level that would indicate a contraction, the PMI has fallen consistently from its high of 64.7 back in May 2021.
Takeaway for Investors
There are a number of leading indicators investors can look at to get a sense of the economy and the direction of stock markets. From watching the Dow Jones Transportation Average, inventory-to-sales ratios, and inflation both at the consumer and purchase manager level, investors can stay informed of the economic environment. Unfortunately, all three of these leading indicators now seem to be signaling a slowdown is already emerging in the economy.
More By This Author:
Bitcoin, Gold, Stocks, Or I-Bonds – What Is The Best Hedge Against Inflation?
Hawkish Vs. Dovish And Why Investors Should Watch For Cues
A Dive Into Walmart’s Supply Chain And Understanding Vendor Management Inventory


Comments
Log in or sign up to join the conversation.