
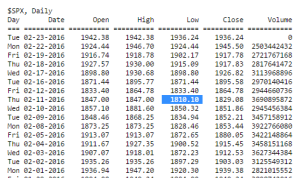
2CS Indicator Back Above 20 After Market Rallies 7.5%
On Monday February 22,2016 the S&P500 closed at 1945.50, 135.40 points higher than its February 11, 2016 low of 1810.10.The market gained 7.5% from its intraday low in just six trading days or 1.25% per day average.
Does the rally have further room to run to the upside?We can get a clue from the 2CS indicator.
Invented by Tom Drake, the 2CS is the five day moving average of the product of the VIX (CBOE Volatility Index) and its put to call ratio. On his blog posted titled, 2CS, Tom wrote:
“My favorite and simplest sentiment measure of the US stock market is the 2CS. Take each day's CBOE put/call ratio and multiply by each day's VIX or VXO (I have used the VXO since 1996). Sum the last five days of the daily product of VXO times P/C. When that five day total or 2CS gets under 70 we can start to wonder about the possibility an intermediate term top somewhere ahead. Sometimes the market will stall or go sideways a bit and relieve this condition, and then go higher again. But sometimes 2CS will continue to fall as the market moves up and get below 60. 2CS below 60 is almost always indicative of a significant decline within a week or two.”
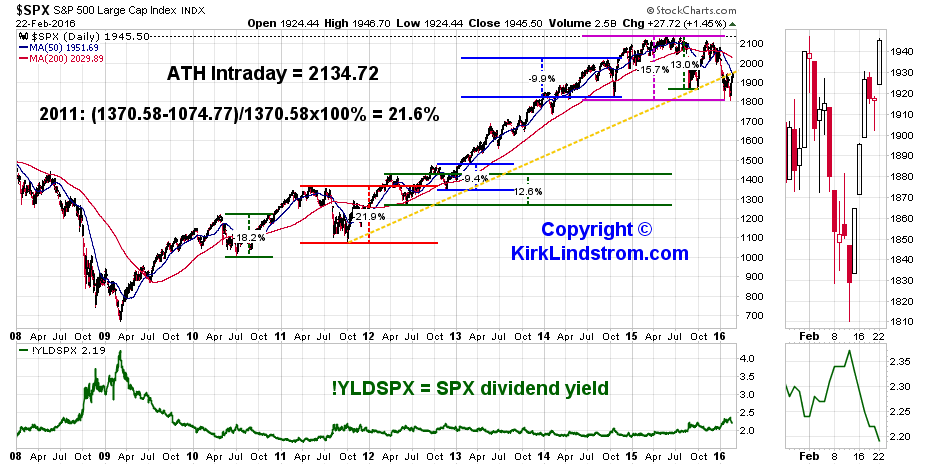
When used as a contrarian indicator, the scale on my graph below runs from 0 to 100% with 0% the maximum bullish reading and the 100% maximum bearish reading.
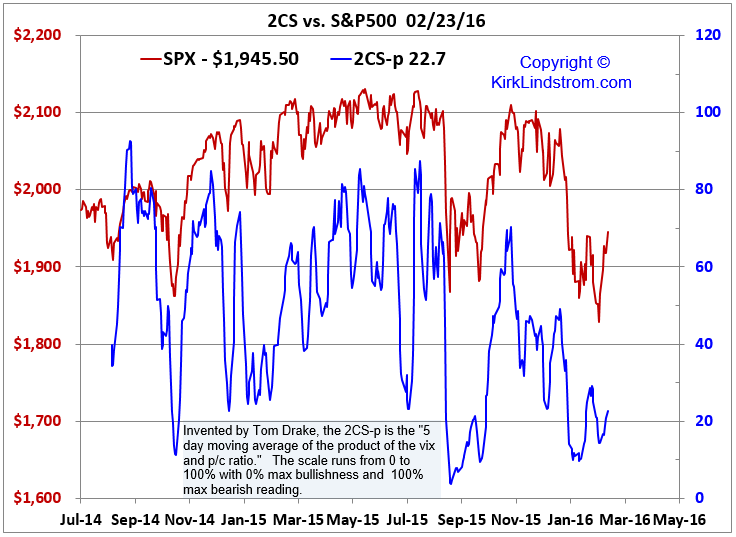
In the past two years, buying the S&P500 when the 2CS was under 30 has yielded good results within a few months. Buying when under 20 has produced even better results.Will this trend continue?
Disclosure: I am long SPY and own the traditional index fund versions of VTI and VOO bought long ago in various taxable and tax deferred ...
more


very informative information share with us.