2025? This Market Performs Well In Odd Years
There is some information that hardly any investors seem to know – and yet it is so valuable!
As such, I would like to share this information with you today. It is highly relevant at the start of the year 2025.
Have you ever considered that whether a year ends in an odd digit (like 5 at the end of 2025) might make a big difference in some markets?
These differences exist in the shares of small companies, such as those included in the Russell 2000 – and they are in fact big differences!
The Russell 2000 in even years
As you may know, in 2024 the Russell 2000 performed worse compared to the wider market.
2024 ends with the even number 4.
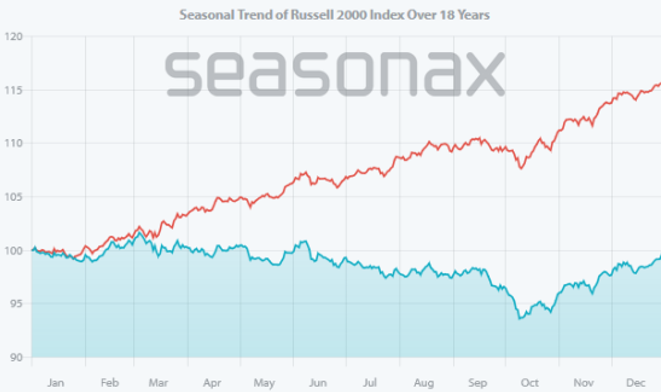
So, let’s look at the seasonality of the Russell 2000 only in years that end with an even digit. The chart below shows you the seasonal trend over every even year in the past 37 years, (i.e in 18 years in total).
For comparison, I have drawn the seasonal trend of the S&P 500 in the same years as a red line.
Russell 2000, seasonal trend only in the even years (blue) compared to S&P 500 (red)

The deviation is significant. Source: Seasonax
As you can see, the performance of small companies in the Russell 2000 in even years is far worse than that of the medium and large companies in the S&P 500.
The deviation widens steadily from March to October.
This is a remarkable phenomenon, and yet one that hardly any investors are likely to be aware of!
From a seasonal perspective, it was therefore to be expected that the Russell 2000 would perform worse than the S&P 500 in 2024.
The Russell 2000 in odd years
But what about years that end with an odd number?
2025 ends with 5, an odd number.
So let’s now look at the seasonality of the Russell 2000 but only in years that end with an odd number.
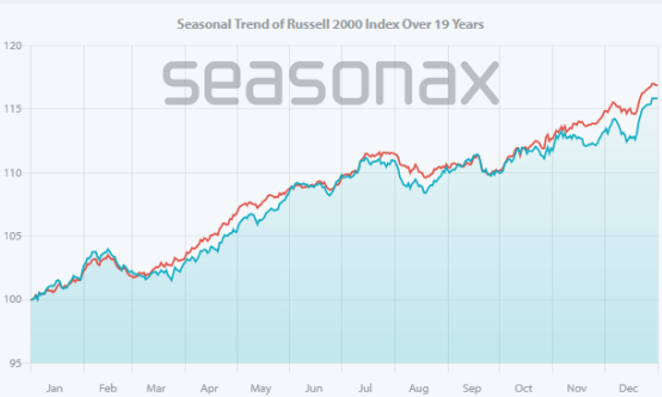
The next chart shows the seasonal trend over the other half of the past 37 years i.e. over 19 odd years.
For comparison, I have drawn the seasonal trend of the S&P 500 for the same years, again as a red line.
Russell 2000, seasonal trend only in odd years (blue), S&P 500 in odd years (red)

The deviation has disappeared. Source: Seasonax
As you can see, the performance and seasonal trend of the Russell 2000 in odd years is roughly comparable to that of the S&P 500.
While the prices of small companies perform far worse than medium and large companies in even years, there is hardly any difference in odd years.
Don’t you find this difference between odd and even years astonishing?
Although 2024 ended with an even number and the Russell 2000 performed weaker than the S&P 500, 2025 is now an odd year.
Is it therefore time to consider small companies for 2025?
More By This Author:
Gold Bull Market: Buy Mines Now?The US Election: Will Stock Prices Rise Or Fall?
Volatility: The Calm Before The Storm?
Disclaimer: Past results and past seasonal patterns are no indication of future performance, in particular, future market trends. seasonax GmbH neither recommends nor approves of any particular ...
more


