
2020 Large Cap Stocks List, Plus Our Top Ten Picks
It is likely that at some point, investors have come across the term market capitalization (or market cap), although many investors may not know what the term means. But the concept of market capitalization is very straightforward.
Market capitalization simply refers to the total value of a company’s outstanding stock. It is calculated by multiplying a company’s shares outstanding by its current share price. Put differently, market capitalization is how much money it would cost to buy every outstanding share of a publicly-traded company.
Large-cap stocks represent businesses with market caps above $10 billion. There are hundreds of large-cap stocks to choose from. With this in mind, we have compiled a list of over 400 large-cap stocks in the S&P 500 Index, with market caps of $10 billion or more.
Overview of Large-Cap Stocks
To calculate a stock’s market capitalization, simply multiply the share price by the number of outstanding shares. For example, a stock with a share price of $100 and 1 million shares outstanding, will have a market capitalization of $100 million. While this is certainly a lot of money, in terms of the stock market, this stock would qualify as a micro-cap.
Stocks classified by market capitalization are separated into multiple tiers. At the bottom is micro-caps—these are very small companies with market capitalizations below $300 million. Next are small caps, which have market capitalizations of $300 million to $2 billion.
After small caps, investors can choose to buy mid-cap stocks, which generally have market capitalizations of $2 billion to $10 billion.
Finally, there are large-cap stocks, which have market capitalizations above $10 billion. Investors are likely familiar with large-cap stocks, as these are the kinds of companies that populate the most well-known index, the Dow Jones Industrial Average.
The Top 10 Large Cap Stocks To Buy Right Now
With all of the above in mind, we created a list of over 400 stocks that each have market capitalizations above $10 billion. But for long-term income investors, these stocks must be filtered down to the best buys today.
The following 10 stocks represent large-caps with market capitalizations above $10 billion, but they also have durable competitive advantages, long-term growth potential, and all pay dividends to shareholders. Some have increased their dividends each year, for many years.
These 10 stocks are ranked by five-year expected total returns. A qualitative assessment of their business models and growth potential was also applied. Because of this, no MLPs were included in the rankings, due to their unique risk factors.
Finally, only stocks with Dividend Risk scores of C or better were included. This step was taken to focus on stocks with sustainable payouts in addition to their high yields. Stocks are ranked by 5-year annual expected return, from lowest to highest.
Top Large Cap #10: Bank of Nova Scotia (BNS)
- 5-year expected returns: 14.0%
Bank of Nova Scotia (often called Scotiabank) is the third-largest financial institution in Canada behind the Royal Bank of Canada (RY) and the Toronto-Dominion Bank (TD). Scotiabank has a market capitalization of $52 billion.
Scotiabank reported fiscal Q2 2020 results on 5/26/20. Revenue increased 2% to C$8.0 billion year-over-year, thanks to a 5.3% gain in net interest income, offset by a 2% decline in non-interest income. Net income fell 41% to C$1.3 billion, due to C$1.85 billion in provision for credit losses, which more than doubled from the year-ago period. On an adjusted basis, earnings-per-share fell 39%.
You can see a snapshot of Scotiabank’s capital and liquidity position at quarter-end in the image below:
(Click on image to enlarge)
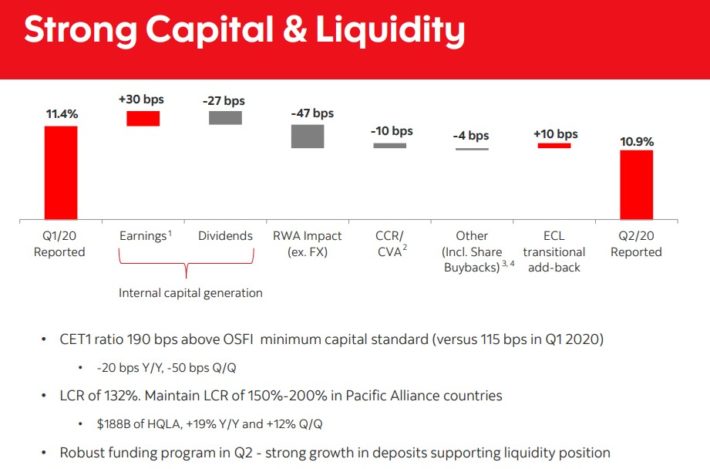
Source: Investor Presentation
In the core Canadian Banking segment, revenue was flat as 4% growth in net interest income was offset by an 11% decline in non-interest income. Loans and deposits each increased 4% for the quarter, while net interest margin contracted by 7 basis points.
The best-performing segment for the company last quarter was its Global Banking & Markets business, which registered 25% year-over-year net income growth. Strong trading revenue led to 27% revenue growth for the most recent quarter.
Despite slowing economic growth, we believe the bank is capable of growing EPS by 5% annually on average through 2025. The bank’s consistent organic and acquired revenue growth will likely drive the top and bottom lines higher in the long run. Scotiabank has a noticeably differentiated growth strategy when compared to its peers in the Canadian banking industry.
While other banks have focused on expanding into the United States, Scotiabank’s future growth should come primarily from its rapidly-expanding International Banking segment, which provides banking services in emerging economies like Mexico, Peru, Chile, and Colombia.
Bank of Nova Scotia pays an annual dividend of $3.60 in Canadian currency; in U.S. dollars, the annual payout of $2.57 per share yields nearly 6% right now. In addition to EPS growth and the impact of a rising P/E multiple, we expect total annual returns of 14.0% through 2025.
Top Large Cap #9: Enbridge Inc. (ENB)
- 5-year expected returns: 14.3%
Enbridge is an oil & gas company that operates the following segments: Liquids Pipelines, Gas Distributions, Energy Services, Gas Transmission & Midstream, and Green Power & Transmission. Enbridge currently trades with a market capitalization of $65 billion.
Note: As a Canadian stock, a 15% dividend tax will be imposed on US investors investing in the company outside of a retirement account. See our guide on Canadian taxes for US investors here.
An overview of Enbridge’s business model can be viewed in the image below:
(Click on image to enlarge)
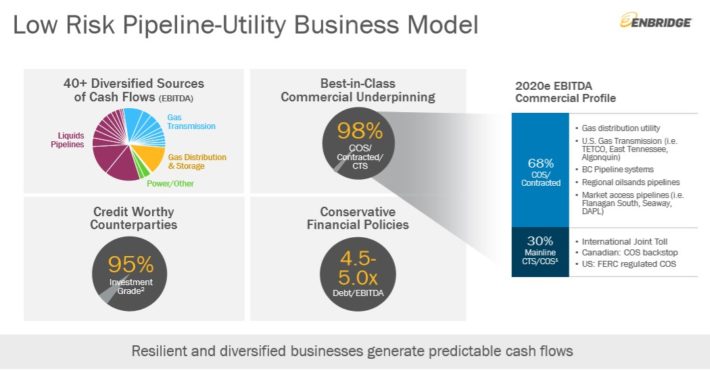
Source: Investor Presentation
In the 2020 first quarter, Enbridge reported a GAAP loss of $1.4 billion, compared with a GAAP profit of $1.9 billion in the same quarter last year. The loss was driven by non-recurring charges such as a non-cash impairment of the company’s investment in DCP Midstream of $1.7 billion, and non-cash unrealized derivative fair value losses of $1.9 billion.
Adjusting for non-recurring charges, adjusted earnings-per-share actually increased 2.5% to $0.83 for the 2020 first quarter. Distributable cash flow of $2.7 billion declined fractionally from the same quarter last year. The company also reaffirmed its full-year outlook, expecting distributable cash flow of $4.50 to $4.80 per share. This should keep the company’s current annual dividend of $2.30 per share intact.
Enbridge produced extremely consistent cash-flow-per-share growth from 2009 to 2016, reporting positive growth every year, at a compelling growth rate of 10% annually. We expect 5%-6% annual cash flow per share growth for Enbridge over the next five years, due primarily to new projects. Enbridge put more than $10 billion worth of projects into service during the last two years, and more growth projects are under construction.
The combination of cash flow growth, dividends, and valuation changes results in expected annual returns of 14.3% per year over the next five years.
Top Large Cap #8: Sun Life Financial (SLF)
- 5-year expected returns: 14.7%
Sun Life Financial is a financial services company that offers insurances, wealth management, group benefits, and retirement services. Sun Life Financial has divisions that operate in the US, in Canada, and in Asia. Sun Life Financial is headquartered in Canada and has a market capitalization of approximately $22 billion.
(Click on image to enlarge)
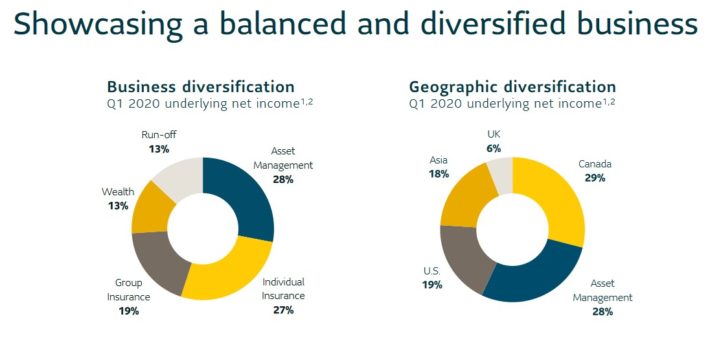
Source: Investor Presentation
Sun Life Financial reported its first-quarter earnings results on May 5. Sun Life insurance sales declined 1% year over year, to US$580 million. Assets under management rose to CAD$1.02 trillion, up from $1.01 trillion at the end of the previous year’s quarter.
Sun Life Financial generated underlying net profits of US$0.97. This beat the analyst consensus estimate and rose by 9% from the prior year. Underlying return on equity of 14% during the quarter expanded from 13% ROE during the previous year’s quarter. The coronavirus is, so far, not having a large impact on the company’s results.
Looking ahead, Sun Life Financial will benefit from attractive market growth rates in the Asian markets it is active in. The company is pursuing additional customer growth in markets such as Hong Kong and the Philippines in the future, both for its insurance business, as well as for its wealth management business. Assets under management were down in 2018, but have recovered in 2019 and 2020. We expect 7% annual EPS growth through 2025.
Sun Life Financial has set targets for the medium-term, which include earnings-per-share growth of 8%-10% annually, an underlying return on equity of at least 12%-14%, and a dividend payout ratio of 40%-50%.
Sun Life shares trade for a price-to-earnings ratio of 9.3, below our fair value estimate of 11. An expanding price-to-earnings ratio could increase annual returns by 3.4% per year through 2025. The stock also has a dividend yield of 4.3%. Total returns are expected to reach 14.7% per year over the next five years.
Top Large Cap #7: Walgreens Boots Alliance (WBA)
- 5-year expected return: 14.8%
Walgreens Boots Alliance has a market cap of approximately $37 billion. The stock has a high rate of return over the next five years, due mostly to a low valuation and a high dividend yield of 4.4%. Walgreens is also a proven dividend growth stock. The company has increased its dividend for 44 consecutive years, placing it on the exclusive list of Dividend Aristocrats.
Walgreens Boots Alliance is a pharmacy retailer with over 18,000 stores in 11 countries. On April 2nd, 2020 Walgreens reported Q2 fiscal year 2020 results for the period ending February 29th, 2020. For the quarter sales increased 3.7% to $35.8 billion, up 4.1% on a constant currency basis, led by a 3.8% increase in the Retail Pharmacy USA segment and a 5.7% increase in the Pharmaceutical Wholesale segment.
Adjusted net earnings decreased -11.8% to $1.3 billion, while earnings-per-share equaled $1.52, down -7.3% compared to the same quarter a year ago, on a significantly lower share count.
Once again, Walgreens’ pharmacy business led the way last quarter.
(Click on image to enlarge)
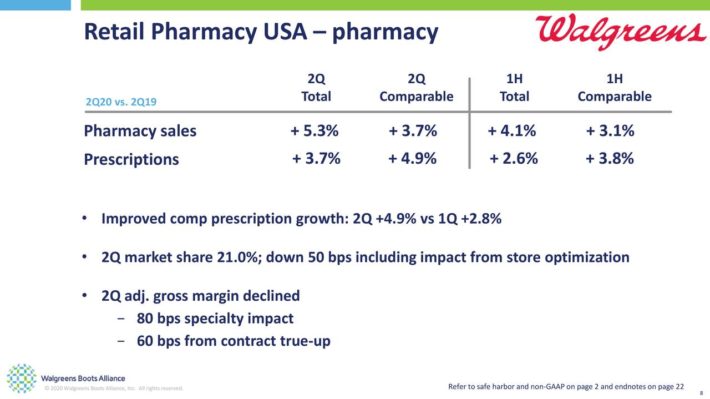
Source: Investor Presentation
The company has withdrawn its guidance for the full year, due to uncertainty related to the coronavirus. But we expect the company to generate long-term growth. Walgreens made progress on a number of strategic initiatives in recent quarters.
It created a German wholesale joint venture with McKesson (MCK) and formed a group purchasing organization with Kroger (KR) as it believes these strategic partnerships will help it grow its market share. It is also accelerating its digitization, restructuring its retail business by transforming its stores into neighborhood health centers, and significantly improving cost efficiencies.
While the company continues to be plagued by sluggishness and growing competition in the space, there should be plenty of room for growth next year and beyond, thanks to sales growth, strategic initiatives, and the continued integration of the Rite Aid acquisition.
Walgreens’ competitive advantage is its leading market share. Its robust retail presence and convenient locations encourage consumers to use Walgreens instead of its competitors. This brand strength means customers keep coming back to Walgreens, providing the company with stable sales and growth.
Despite its weak fiscal year, Walgreens has a positive long-term growth outlook. Retail Pharmacy has proven to be resistant to e-commerce and will benefit from the aging U.S. population and rising demand for healthcare. The company also raised its cost-cutting target from $1.5 billion, to over $1.8 billion by fiscal 2022.
Walgreens has a current share price of ~$42 and a midpoint for adjusted earnings-per-share of $5.50 for fiscal 2020. As a result, the stock trades for a price-to-earnings ratio of 7.7. This is a low valuation for a highly-profitable company, especially one with a strong brand and leadership position in its industry. Over the past 10 years, Walgreens held an average price-to-earnings ratio of 16.2.
As a result, Walgreens stock appears to be undervalued, relative to both the broader market as well as its own historical averages. But due to Walgreens’ slower growth and current headwinds, we have a 2025 price-to-earnings ratio target of 10 for the stock. Shares currently trade for a 2020 P/E ratio of 7.7, leading to positive returns of 5.4% per year from valuation expansion.
Plus, Walgreens has 5% expected annual earnings-per-share growth and a 4.4% dividend yield. In this forecast, total annualized returns could reach 14.8% over the next five years.
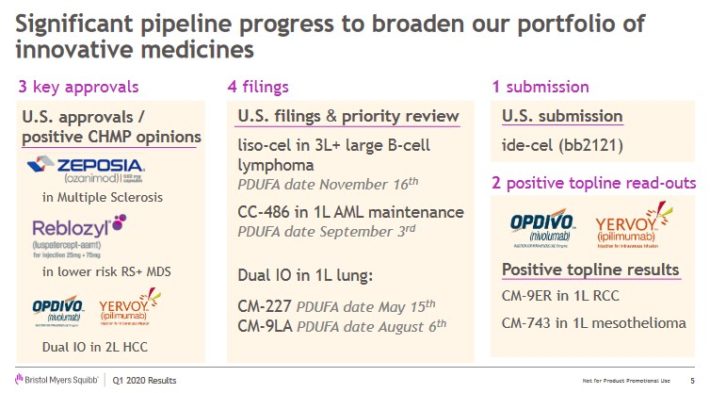
Top Large Cap #6: Bristol-Myers Squibb (BMY)
- 5-year expected returns: 14.9%
Bristol-Myers Squibb was created when Bristol-Myers and Squibb merged on October 4th, 1989. Bristol-Myers can trace its corporate beginnings back to 1887. Today this leading drug maker of cardiovascular and anti-cancer therapeutics has annual revenues of more than $42 billion. The stock has a market capitalization of $129 billion.
The company has prepared for this by investing in multiple new products that will lead the company’s future growth.
(Click on image to enlarge)
Source: Investor Presentation
On 5/7/2020, Bristol-Myers reported first-quarter earnings results. Adjusted earnings-per-share increased 56% to $1.72, beating estimates by $0.27. Revenue increased 82% to $10.8 billion, which was $730 million higher than expected. Excluding the acquisition of Celgene and a positive impact from the COVID-19 pandemic, revenue increased 8%.
Eliquis sales increased 37% to $2.6 billion. Another growth product is Orencia, which grew sales by 12% last quarter. Future growth will be derived from investments in organic growth and a rebuilt pipeline, as well as the $74 billion acquisition of Celgene.
The company’s competitive advantage is its ability to either create (through research & development) or acquire patents for pharmaceuticals with high potential revenue. Bristol-Myers top two selling pharmaceuticals, Opdivo and Eliquis, have shown solid growth rates and are expected to see high peak annual sales. The addition of Celgene should add to the top and bottom lines.
The company reaffirmed previous guidance of adjusted earnings-per-share in a range of $6.00 to $6.20 for 2020. Bristol-Myers expects 20% adjusted earnings-per-share growth in 2021. We expect 4% annual EPS growth through 2025.
The stock has a 2.9% dividend yield and has a price-to-earnings ratio of 9.3. This is below our fair value estimate of 13.5, meaning the stock is undervalued. An expanding P/E multiple could add 7.7% to the stock’s annual returns over the next five years. Bristol-Myers Squibb shares also have a current dividend yield of 3.2%. Overall, we expect total returns of 14.9% per year through 2025.
Top Large Cap #5: Magna International (MGA)
- 5-year expected returns: 15.2%
Magna International Inc. is an automotive supplier. It began working with General Motors (GM) back in 1957. Since then, it has become the largest automotive supplier in North America and the third-largest in the world. Magna has
a market capitalization of $13 billion.
Magna is off to a difficult start to 2020. Total sales decreased 18% to $8.7 billion in the first quarter of 2020, compared to $10.6 billion in the first quarter of 2019, on a year-over-year basis. The reason for the decline is the coronavirus crisis, which has had a pronounced impact on global auto sales.
Global vehicle production declined 27% for the quarter, which naturally impacted automotive supply sales. Adjusted diluted earnings per share for the first quarter of 2020 were $0.86, down from $1.63 for the first quarter of 2019.
Despite the weak first-quarter results, we see the potential for long-term growth. One major growth trend is electrification.
(Click on image to enlarge)

Source: Investor Presentation
In late February, it used its new e4 technology demonstrator car the set a new benchmark in electric vehicles in terms of efficiency, driving dynamics, and range.
Share repurchases have been suspended during the coronavirus, but we believe continued share buybacks will boost long-term earnings-per-share growth. Overall, we expect 6% annual EPS growth through 2025.
As one of the leading automotive suppliers in the world with about 346 manufacturing operations, Magna benefits from economies of scale. It’s also innovating by investing in electrification and autonomy, which should help keep the company relevant.
In the last recession, Magna ran into trouble and operated at a loss and cut its dividend in 2009. It survived through it and has thrived by compounding EPS by about 13% per year from 2011 to 2019. Still, investors should note that a prolonged recession could have a pronounced impact on Magna.
Magna stock trades for an appealing P/E ratio of 7, below our fair value estimate of 9.2, which is equal to the average valuation multiple from 2010 to 2019. An expanding P/E ratio could boost annual returns by 5.6% per year. In addition to expected EPS growth and the 3.6% dividend yield, we expect total returns of 15.2% per year through 2025.
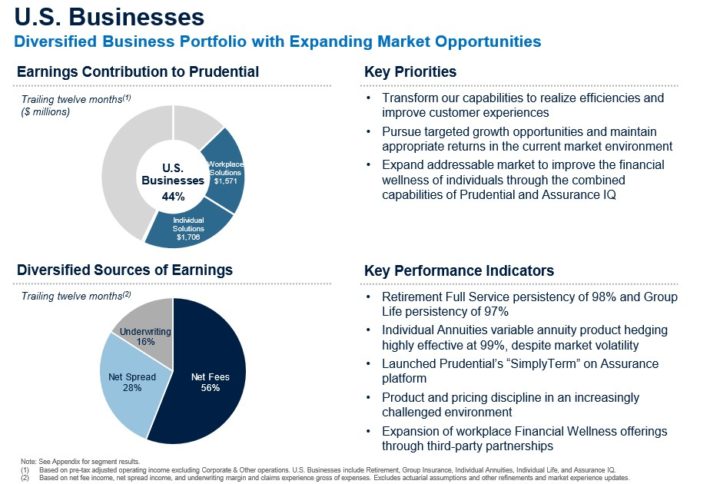
Top Large Cap #4: Prudential Financial (PRU)
- 5-year expected returns: 15.6%
Prudential has increased its dividend for over 10 years in a row. And with a high yield of 6.6%, we view Prudential as a blue-chip stock.
Prudential Financial is a global financial institution with $1.5 trillion in assets under management. The company provides financial products including life insurance, annuities, retirement-related services, mutual funds, and investment management.
On May 5th, 2020 Prudential released the first quarter 2020 results. Prudential reported a net loss of $271 million, or $0.70 per share. After-tax adjusted operating income of $939 million or $2.32 per share, represented a year-over-year decline of 23%. Adjusted book value per share of $99.71 rose 3% year-over-year. Assets under management amounted to $1.481 trillion, up from $1.456 trillion at the same time last year.
You can see an image of Prudential’s core U.S. segment performance in the image below:
(Click on image to enlarge)
Source: Investor Presentation
From 2007 through 2019, Prudential grew earnings-per-share by approximately 4.0% per year. We currently expect 4% annual EPS growth through 2025. Earnings growth will be aided by cost reductions and investment in growth initiatives. Last year, the company launched a process, talent, and technology transformation with expected $500 million of cost savings.
Separately, in September 2019 Prudential acquired Assurance IQ for $2.35 billion, plus an additional payout of up to $1.15 billion if Assurance achieves multi-year growth targets. Assurance is a high-growth direct-to-consumer platform that improves the consumer experience for those looking for health and financial wellness solutions.
Prudential stock trades for a price-to-earnings ratio of 6.3, below our fair value estimate of 8.0. Therefore, an expanding P/E multiple to the fair value estimate could add 4.9% to the stock’s annual returns through 2025. In addition, expected EPS growth of 4% and the 6.7% dividend yield combine for total expected returns of 15.6% per year.
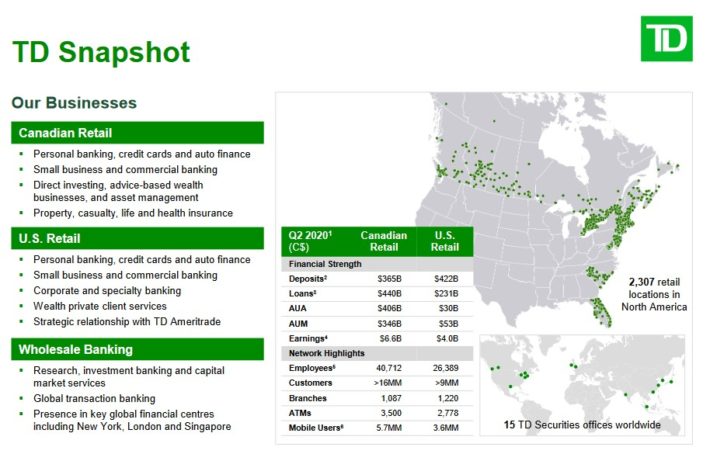
Top Large Cap #3: The Toronto-Dominion Bank (TD)
- 5-year expected returns: 17.0%
Toronto-Dominion Bank traces its lineage back to 1855 when the Bank of Toronto was founded. The bank produces more than C$40 billion in revenue each year. The stock market capitalization is currently above $83 billion.
An overview of TD’s businesses can be seen in the image below:
(Click on image to enlarge)
Source: Investor Presentation
In the most recent quarter, TD’s adjusted earnings-per-share fell 51% from the same quarter a year ago. Like many other banks, TD absorbed significantly higher provisions for credit losses. Provision for credit losses of C$3.22 billion for the quarter rose from C$633 million in the same quarter last year. The coronavirus crisis has led to a deteriorating global economy, although the financial sector will benefit from an economic recovery as well.
TD’s earnings-per-share history was very stable with a 6.5% growth rate from 2010 to 2019. With the headwinds of lower interest rates and slower economic growth, we forecast 6% growth annually long term.
Earnings growth will be based in large part on continued loan growth. TD’s Canadian and American retail units have strong brands and large distribution networks, assuring TD’s loan growth plans can be achieved over the long term.
Its leading position in the Canadian credit card business as a key competitive advantage that will drive future growth. The dividend is well-covered, and TD raised its dividend by 6.8% in fiscal Q1, indicating that the bank is committed to returning excess capital to shareholders. We expect 6% adjusted EPS growth over the next five years.
Based on 2020 expected EPS of approximately US$5.32, TD stock trades for a 2020 price-to-earnings ratio of 8.6, which is below our fair value estimate of 11.5. If it takes five years for the valuation multiple to expand to the fair value estimate, annual returns would increase by 6.0% per year. In addition to expected EPS growth and dividends, we expect total annual returns of 17.0% per year through 2025.
Top Large Cap #2: Discover Financial Services (DFS)
- 5-year expected returns: 18.2%
Discover Financial Services is a holding company that offers a wide range of financial services to its customers. Its operations are divided into the Direct Banking and Payment Services segments, respectively.
The Direct Banking segment issues credit cards under the Discover brand to consumers and small businesses, while the Payment Services segment controls the Diner’s Club business, and offers services through the Discover Network for cards that are issued from third parties.
2019 was another year of across-the-board growth for Discover.
(Click on image to enlarge)

Source: Investor Presentation
Discover Financial Services reported its first-quarter earnings results on April 23. The company reported that its revenues totaled $2.9 billion during the quarter, which was 4.7% more than the revenues that Discover Financial Services generated during the previous year’s quarter.
Revenue growth was primarily due to an increase in Discover Financial Services’ net interest income. This, in turn, was made possible primarily thanks to growth in the company’s loan portfolio, which expanded by 5% year-over-year, to $93 billion.
Discover Financial Services generated earnings-per-share of -$0.25 in the first quarter, which was not comparable to the previous year’s Q1 profit. The net loss during the first quarter was based on a big increase in the company’s provisions for loan losses, as Discover Financial expects that charge-offs will increase during the second quarter, and potentially through the second half of the year as well.
Discover Financial Services’ earnings-per-share growth outlook is robust when we back out the coronavirus impact in the near-term. One factor for rising profits is growth in Discover Financial Services’ loan balances, which are forecast to grow further over the coming years, following meaningful increases in the mid-single-digits range during the last couple of years.
The impact of Discover Financial Services’ buybacks will play a major role for its earnings-per-share growth as well. The company bought back more than 40% of its shares between 2009 and 2019. Buybacks were suspended in the near term due to the coronavirus crisis, but should resume once operations are back to a more normal level.
Discover stock trades for a 2020 price-to-earnings ratio of 6.6, based on our normalized earnings estimate of $8.50. Our fair value estimate is a P/E ratio of 9-10. Therefore, an expanding P/E multiple could boost annual returns by 7.6% per year through 2025. Combined with 7.5% expected EPS growth and the 3.1% dividend yield, total returns are estimated to reach 18.2% per year over the next five years.
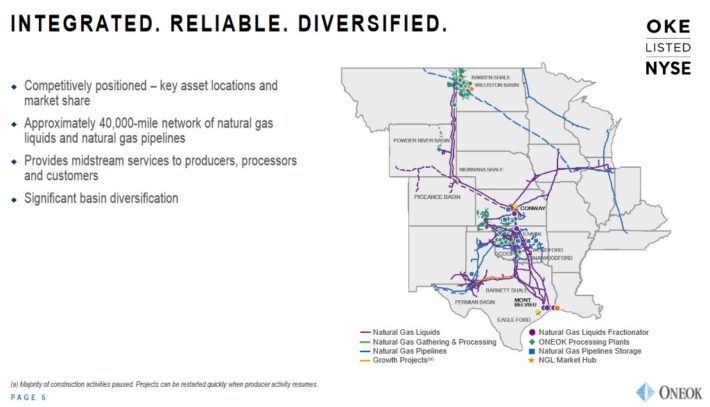
Top Large Cap #1: ONEOK Inc. (OKE)
- 5-year expected returns: 19.3%
ONEOK is an energy company that engages in the gathering and processing of natural gas, as well as a natural gas liquids business and natural gas pipelines (interstate and intrastate). ONEOK also owns storage facilities for natural gas. An overview of ONEOK’s business can be seen in the image below:
(Click on image to enlarge)
Source: Investor Presentation
ONEOK reported its first-quarter earnings results on April 28. The company reported revenue of $2.14 billion during the quarter, down 23% from the previous year’s quarter. ONEOK missed the analyst consensus estimate by $830 million, a sizeable miss.
Unfavorable commodity prices were the main reason for the revenue decline. But ONEOK managed to remain quite profitable, which can be explained by the fact that its input costs declined as well, as those are also partially commodity-price based. During the most recent quarter, ONEOK generated adjusted EBITDA of $700 million, which was actually up 8% versus the previous year’s quarter.
Distributable cash flows totaled $520 million during the quarter, up 3% on a year-over-year basis. Distributable cash flow came in at $1.24 on a per-share basis. ONEOK sees 2020 distributable cash flows declining slightly versus 2019, to $1.94 billion, or roughly $4.65 per share.
A key advantage for ONEOK is that a significant portion of its revenue, especially after the roll-up of its MLP, are fee-based or hedged, which makes the company less sensitive to commodity price swings. This is why ONEOK can operate with considerable leverage without being in dangerous territory, as its cash flows are not very cyclical. The fee-based nature of ONEOK’s revenues and non-cyclical demand for natural gas, e.g. for heating, is what has made ONEOK recession-proof in the past.
Shares of ONEOK trade for a 2020 price-to-earnings ratio of 8.1. Our fair value estimate is a P/E ratio of 10. An expanding valuation multiple could boost annual returns by 4.3% per year through 2025. In addition, the stock has a high dividend yield of 10%. Total returns are expected to reach 19.3% per year over the next five years.
Final Thoughts
With so many various terms, investing can seem overly complex. Market capitalization is a term all stock market investors should understand, and the good news is that it is a fairly simple concept. The market cap of a stock refers to the total value of all its outstanding shares.
Market cap gives investors a better gauge of a company’s size, which can also give clues about its competitive advantages and future growth potential.
Large-caps are generally safer than small-caps because they are less volatile and tend to have more established business models. Large-caps also have a greater tendency to pay dividends to shareholders. For these reasons, income investors looking to reduce volatility in their stock portfolios should give special consideration to large caps.
In particular, we believe the 10 large-cap stocks on this list are leaders in their respective industries, with proven business models and attractive dividends.
Disclaimer: Sure Dividend is published as an information service. It includes opinions as to buying, selling and holding various stocks and other securities. However, the publishers of Sure ...
more

