
Stock Exchange: Are You Missing The Big Picture?
The Stock Exchange is all about trading. Each week, we do the following:
- Discuss an important issue for traders;
- Highlight several technical trading methods, including current ideas;
- Feature advice from top traders and writers; and
- Provide a few (minority) reactions from fundamental analysts.
We also have some fun. We welcome comments, links and ideas to help us improve this resource for traders. If you have some ideas, please join in!
Review: Brilliant Trading Or Is The Market Just Up?
Our previous Stock Exchange asked the question: Brilliant Trading, or is the Market Just Up? We noted that it’s easy to feel smart when the overall market is up. But just because your account balance is getting fatter, does that mean you are a brilliant trader, or is there something else going on?
This Week: Are You Missing The Big Picture
With trading, it’s easy to get lost in the minutia. Traders often get so caught up in the details of the day to day, that they lose sight of the big picture. For example, consider this example from trading psychologist, Dr. Brett Steenbarger, in his recent post, Three Tough Questions Traders Need to Ask Themselves:
I work with traders who do a great job of tracking their most recent trades and figuring out what they did right and wrong each day. What they don’t do as well is ask the big questions. It is like a company that gets better and better at manufacturing their product, but fails to look at the bigger picture of supply/demand for that product. It doesn’t help to get better at making manual typewriters or flip phones when those are becoming extinct. No amount of focus on tactics can substitute for effective strategy.
Are you the best typewriter producer in the world, and if so what good does that do you?
Another great example of missing the big picture comes from Nassim Taleb in his famous book, The Black Swan. Dan Jacob Wallace does an excellent job summarizing in his blog, so we’ll share an excerpt here:
Imagine… posing the following question to two characters, the rational & educated Dr. John and the intuitive & streetwise Fat Tony:
Assume that a coin is fair, i.e., has an equal probability of coming up heads or tails when flipped. I flip it ninety-nine times and get heads each time. What are the odds of my getting tails on my next throw?
Dr. John refers to the question as trivial and gives the mathematically correct answer of one half. Fat Tony calls Dr. John a sucker and says, “no more than 1 percent, of course … the coin gotta be loaded.”
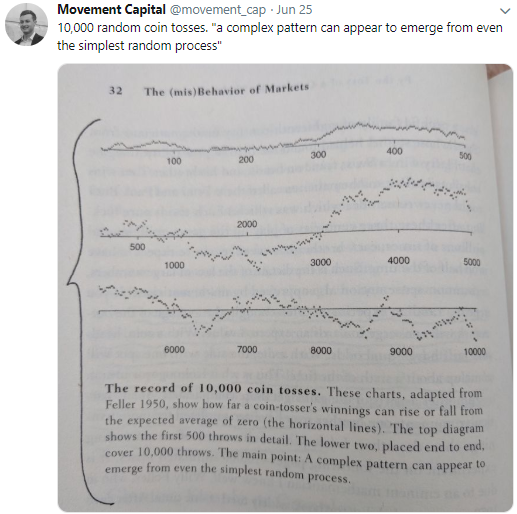
Has Dr. John missed the big picture? Or Perhaps Fat Tony got it wrong? Here is a great chart from Movement Capital suggesting even random coin tosses can take on “complex patterns.”
The point is that it’s important to take a look at the big picture once in a while. Is your trading strategy still a good one, and is it right for you? For more perspective, legendary trader Charles Kirk recently noted the big picture rules may not apply when he wrote on June 23rd:
“It is often said that markets climb the stairs on the way up, but take the elevator on the way down. Yet, once again we see a market that has no respect for the rules.
Following its four-week selling streak in May, in three weeks U.S. markets have rallied right back and have mostly fully recovered from the pullback in May. New all-time intraday and closing highs have been successfully set in the S&P 500. With one week left to go, this is currently the best June since 1955.”
Again, the point is simply to pay attention to the big picture and how changes may impact the details of your trading strategy.
Model Performance
We are sharing the performance of our proprietary trading models as our readers have requested.

For more information about our models (and their specific trading processes), click through at the bottom of this post for more information (readers are additionally invited to write to main at newarc dot com for our free, brief description of how we created the Stock Exchange models).
Expert Picks From The Models
Note: This week’s Stock Exchange report is being moderated by Blue Harbinger, a source for independent investment ideas.
Holmes: I bought shares of Planet Fitness (PLNT) on 6/24. You can see the chart below.
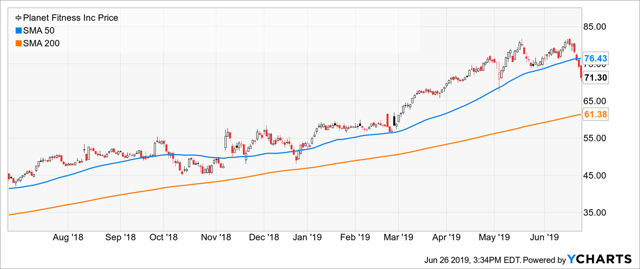
Blue Harbinger: That is interesting because if I recall, Road Runner bought shares of PLNT last week. He likes to buy dips in a rising technical channel, but you are more of a pure “dip buyer,” correct Holmes?
Holmes: There’s more to it than simply buying dips, but your description is on the right track. More specifically, I use a mean-reversion approach to identify stocks that have moved “abnormally” far from their recent price history. And PLNT did, and I also identified the additional conditions necessary for me to purchase.
BH: Well, like I told Road Runner, I think Planet Fitness is probably getting some good rent concessions, because every time I hear about a struggling shopping mall REIT, management is always talking about renting the former space of bankrupt retailers to experiential businesses, such as fitness franchises. Here is a look at the F.A.S.T. Graph.
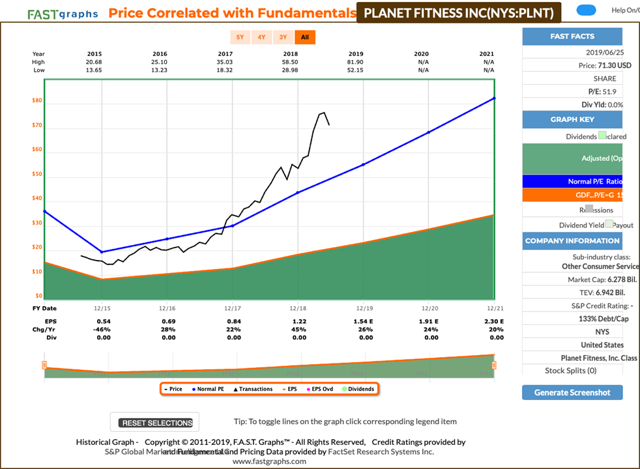
Holmes: Thanks but you are thinking too long-term. That fundamental data may play out over the next few quarters or years, but I’ll be out in around 6-weeks, plus or minus.
Road Runner: Well this week I initiated a new trading position in Verisk Analytics (VRSK). And you are correct in noting I like to purchase stocks in the lower end of a rising channel and then hold them for about 4 weeks. What do you think about that?
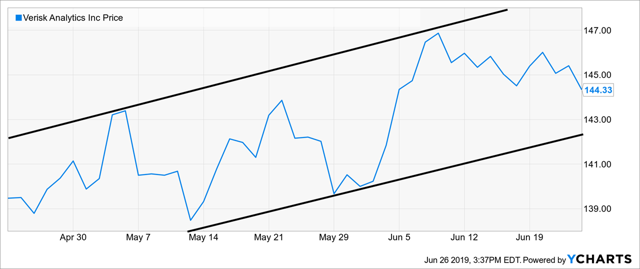
BH: Well, I think your Planet Fitness trade has about three more weeks to go. And I also see the “lower end of a rising channel” thing with Verisk Analytics too. I know you are a trading model Road Runner, but did you know Verisk provides predictive analytics and decision support solutions to customers in rating, underwriting, claims, catastrophe and weather risk, natural resources intelligence, and economic forecasting? Here is a look at the F.A.S.T. Graph.
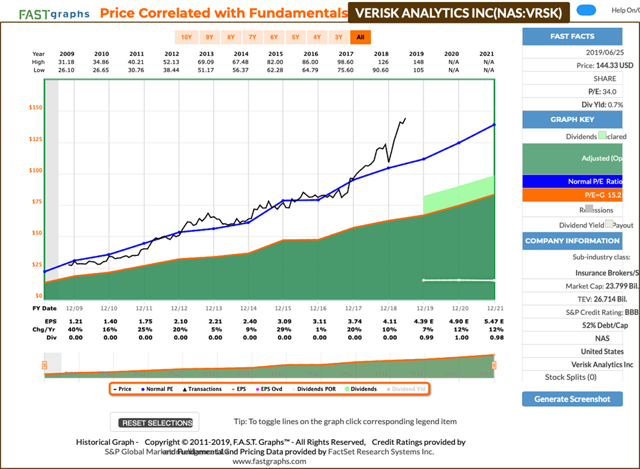
RR: Yes, I am aware, and that F.A.S.T. Graph and fundamental data are nice, but as we’ve discussed previously, I look for a certain type of situation (some call it a pattern, others may call it a setup, etc.) where the probability of a particular action is not a matter of chance (50/50) but has been historically noted to result in a greater tendency towards a particular outcome. “Trending in a channel” is one such situation. An equity will often “cycle” between the upper and lower bounds of that channel for substantial periods of time. My model design attempts to take advantage of this property by identifying stocks trending in an upwards channel and waiting until the stock price drifts to the lower bound, making it a candidate for purchase. These types of situations have a relatively high probability of positive outcome with a reasonable profit potential. Verisk can be seen to be in this type of a situation. This is a short-term trade that has traditionally shown profitability when the right conditions have been met. One way or another, I’ll be out of it shortly – usually after about 4 weeks.
Conclusion
As a trader, it’s easy to get caught in the daily minutia and thereby overlook the big picture. However, it’s worthwhile to stay in tune with the reasons why you are trading in the first place. Does your strategy have a competitive advantage? What are your profit goals? What is your edge? Trading takes focus and attention to detail, but it also takes the awareness to not lose sight of the big picture.
Getting Updates
Readers are welcome to suggest individual stocks and/or ETFs to be added to our model lists. We keep a running list of all securities our readers recommend, and we share the results within this weekly “Stock Exchange” series when feasible. Send your ideas to “etf at newarc dot com.” Also, we will share additional information about the models, including test data, with those interested in investing. Suggestions and comments about this weekly “Stock Exchange” report are welcome. You can also access background information on the “Stock Exchange” here.
We have a new (free) service to subscribers to our Felix/Oscar update list. You can suggest three favorite stocks and sectors. We report regularly on the “favorite fifteen” in each ...
more

