
Stock Exchange: Are You Guilty Of Risk Creep?
The Stock Exchange is all about trading. Each week, we do the following:
- Discuss an important issue for traders;
- Highlight several technical trading methods, including current ideas;
- Feature advice from top traders and writers; and
- Provide a few (minority) reactions from fundamental analysts.
We also have some fun. We welcome comments, links and ideas to help us improve this resource for traders. If you have some ideas, please join in!
Review: Climbing The Wall of Worry
Our previous Stock Exchange was about how the market continues to be Climbing The Wall Of Worry. We noted that despite a non-stop flow fear mongering from the media, the market continues to climb the wall of worry. For example, we just hit fresh all time highs in the S&P 500, and we just completed the best first half of the year in many years.
This Week: Are You Guilty of Risk Creep?
With the Dow Jones Industrial Average again recently regaining new all time highs, what could possibly go wrong? Unemployment is low, the Fed still wants to cut rates, there appears to be a truce in the US-China trade war, the skies are blue, the summer is great, and why wouldn’t you be heavily invested in the market? In fact, growth and technology stocks are doing even better than the Dow–why not invest a little more heavily in them?
“Risk Creep” is real and it doesn’t just apply to investors. If you’ve had a string of successful shorter term trades, there is a tendency to get a little over confident and take on a little more risk than usual. Perhaps it’s your recency bias or perhaps it’s just your big head. Let’s not forget it was just seven months ago when volatility and fear were much higher, and the stock market was falling hard. And just like it may have been wrong to sell everything out of fear back then, is there really any reason to bet the farm now?
If your reading this report, you are probably human (unless you are a google bot, or an AI keyword trading algorithm), and as humans we are all subject to emotions and mistakes. This is why risk management is an important part of any good trading program.
For some color, popular stock trader Timothy Sykes listed 13 Trading Mistakes To Avoid At All Costs earlier this year, and several of them have to do with “risk creep,” such as:
- #6 Trading Too Large Position Sizes
- #10 Letting Emotions Take Control of You
Just because things have been going well doesn’t mean they will always go well. Don’t get overconfident and let your trading positions get too large, and certainly don’t let your emotions be the sole driver of your trades. We utilize technical models to generate trading ideas and trading programs in order to take the emotional risk (as well as risk creep) out of the equation. We’ll have more to say about some specific recent trades of our technical models later in this report.
Model Performance
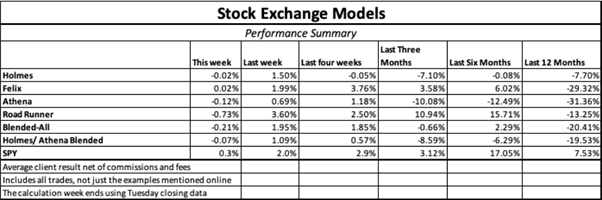
We are sharing the performance of our proprietary trading models as our readers have requested.
Worth noting, our models increase and decrease their cash levels based on market conditions, so the performance in the table can appear more dramatic than reality, especially when considering the strategies are often combined with some of our longer-term strategies as well. Also, we’ve been running these models for a while and backtested the data for very long time periods and thereby understand there are stronger and less strong periods. However, over the long term, we remain very confident in the trading models and continue to invest our own capital according to the models.
For more information about our models (and their specific trading processes), click through at the bottom of this post (readers are additionally invited to write to main at newarc dot com for our free, brief description of how we created the Stock Exchange models).
Expert Picks From The Models
Note: This week’s Stock Exchange report is being moderated by Blue Harbinger, a source for independent investment ideas.
Holmes: I sold VMWare (VMW) thispast week on 7/5.
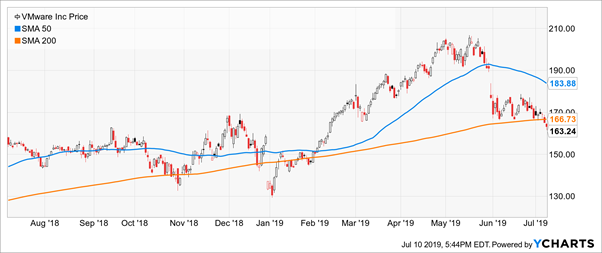
Blue Harbinger: That trade appears to have not been one of your greatest considering you typically hold for around 6 weeks. I know you are a mean reversion or “dip buyer.” What prompted the sale on this one, Holmes?
Holmes: Your are correct, there’s more to it than simply calling me a “dip buyer.” I use a mean-reversion approach to identify stocks that have moved “abnormally” far from their recent price history. And VMW did, and I also identified the additional conditions necessary for me to purchase weeks ago. However, for risk management purposes, I have exited this trade.
BH: You didn’t want to hang on to it for a little longer? It could have rebounded. I mean the fundamentals are not bad. Here is a look at the F.A.S.T. Graph.
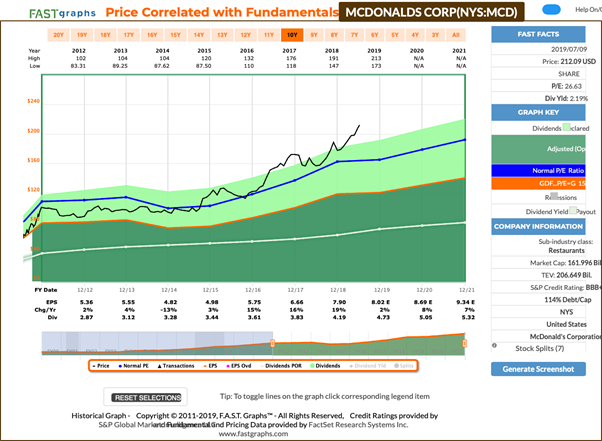
Holmes: No, I didn’t want to “hang on to it a little longer.” That is the attitude of an emotional human. I am a technical trading model, and I don’t succumb to the typical human emotions that cause problems for many traders. I am completely objective.
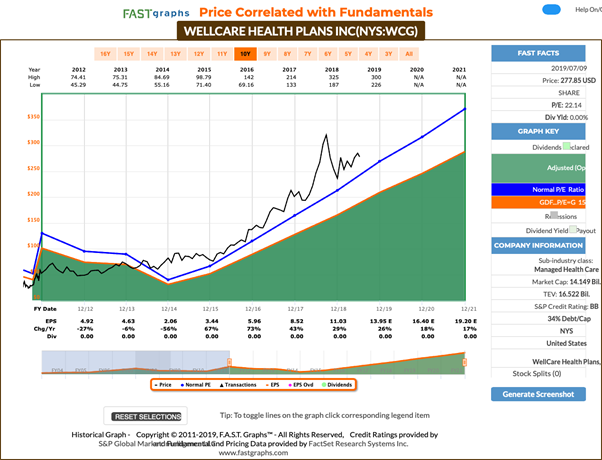
Road Runner: I bought shares of WellCare Health Plans (WCG) this past week on 7/5. As you know, I like to buy things in the lower end of a rising channel.
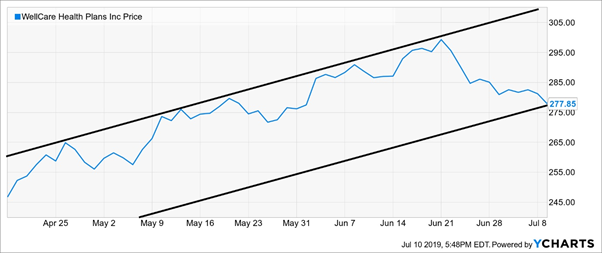
BH: That chart looks like a great setup for your strategy, Road Runner. But how deeply do you get into the long-term fundamentals before purchasing a stock like this? As you know, WellCare provides government-sponsored managed care services. Specifically, the company operates in three segments: Medicaid Health Plans, Medicare Health Plans, and Medicare Prescription Drug Plans. Here is a look at the F.A.S.T. Graph.
Road Runner: I am aware of some fundamental data, but I interpret it differently. My typical holding period is only 4-weeks, and I analyze the data objectively, without typical human emotional mistakes.
And just so you know, I look for a certain type of situation (some call it a pattern, others may call it a setup, etc.) where the probability of a particular action is not a matter of chance (50/50) but has been historically noted to result in a greater tendency towards a particular outcome. “Trending in a channel” is one such situation. An equity will often “cycle” between the upper and lower bounds of that channel for substantial periods of time. My model design attempts to take advantage of this property by identifying stocks trending in an upwards channel and waiting until the stock price drifts to the lower bound, making it a candidate for purchase. These types of situations have a relatively high probability of positive outcome with a reasonable profit potential. WellCare can be seen to be in this type of a situation. This is a short-term trade that has traditionally shown profitability when the right conditions have been met. One way or another, I’ll be out of it shortly – usually after about 4 weeks as I mentioned above.
BH: I’ll keep an eye on WellCare, thanks Road Runner.
Athena: I bought shares of Ball Corp (BLL) on 7/5.
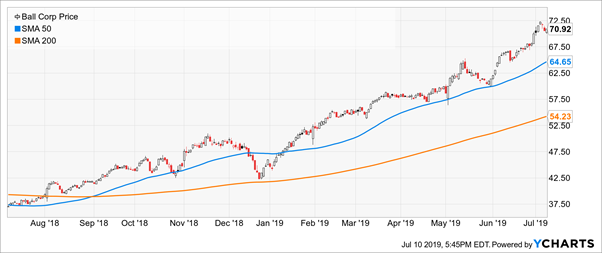
BH: Well I can certainly see the momentum in that chart, Athena. But remind us, what is your technical trading strategy?
Athena: I look for stocks having strong positive trends and then select only those with the very strongest trends (“king of the hill”), constantly replacing the ones with weaker trends. It should not surprise anyone that I bought Ball Corp. A quick look at the chart makes the strength of the trend fairly obvious. And I generally continue to hold my positions until either the strength of the trend abates or a stock with an even higher trend strength comes along. I don’t have a set “holding period” for a position. I will exit only when either a stronger stock comes along or if market conditions dictate a strong potential for loss – capital preservation remains the key driver in all situations.
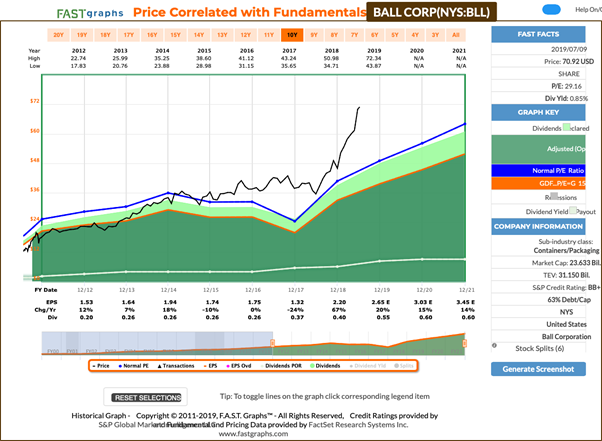
BH: Interesting. If you’re curious, Ball Corp supplies metal packaging products to the beverage, personal care, and household products industries. Here is a look at the F.A.S.T. Graph.
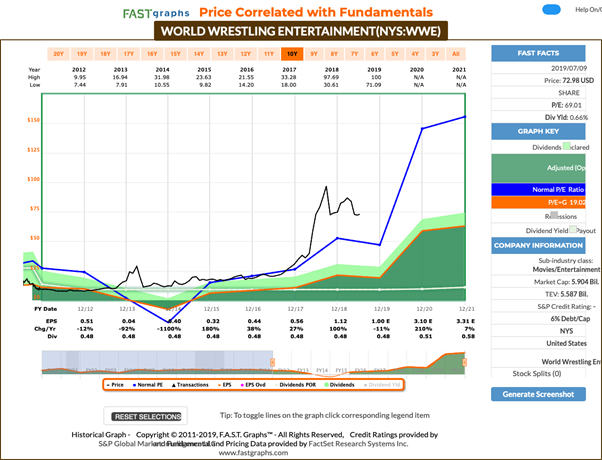
Felix: This past week I bought shares of World Wrestling Entertainment (WWE). You might recall my strategy is also based on momentum, and my typical holding period is considerably longer than the other model, often up to 1 year or slightly longer.
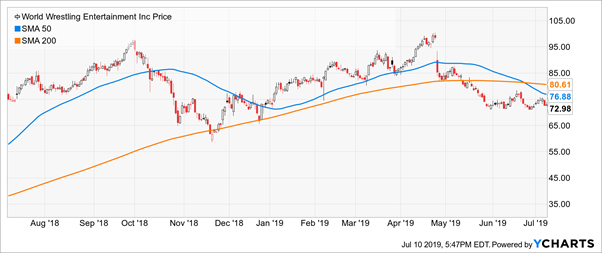
BH: Finally a model that looks out longer than just a few weeks. Here is a look at the F.A.S.T. Graph.
Felix: Thanks for that. I also have some rankings to share. This week I ran the 30 stocks of the Dow through my model, and the top 20 are ranked in the following table.

BH: You are a momentum trader. Microsoft (MSFT) at the top of your ranking has performed very well. Plus many of these Dow Jones names will fall a little less hard than other compenents of the market in a sell-off simply by virtue of their more blue chip businesses. Thank you for sharing.
Oscar: I too have a ranking to share. I am our resident ETF trader, and this week I ran our “High Liquidity ETFs with price-volume multiple over 100 million per day” universe through my momentum model, and the top 20 are shown in the following ranking.
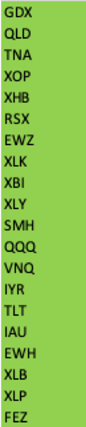
BH: I see the GOld Miners ETF (GDX) ranked at the top of your list. Given the constant monetary policy shifts of the fed that may not be a horrible idea. Thank you for sharing.
Conclusion:
Whether you are seeing your account balance up because the market is up or because you put together a string on winning trades, that’s a good time to check your risk management closely. Specifically, traders and investor alike have a tendency to take on more risk when things are going well, and less risk when they’re not. And these risk levels are often driven by emotions–a generally irrational and often dangerous driver of decisions. Given your recent track record, are you allowing “risk creep” to happen in your portfolio?
We have a new (free) service to subscribers to our Felix/Oscar update list. You can suggest three favorite stocks and sectors. We report regularly on the “favorite fifteen” in each ...
more

