Sunday, December 22, 2019 6:18 AM EDT
The end of 2019 is fast approaching, and this being our last article for the year, we’ll take a look at the bigger picture.
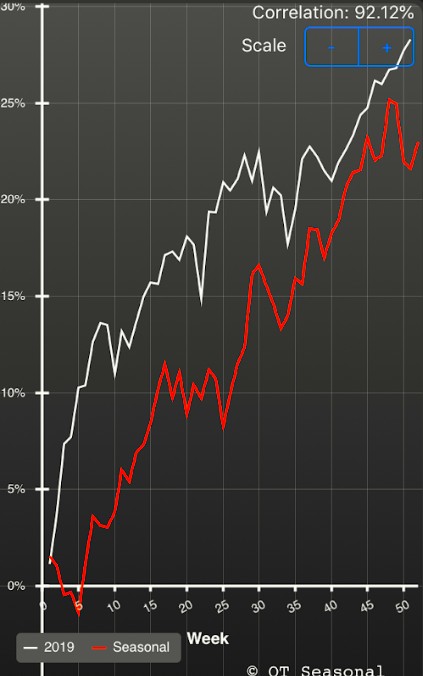
For all the doom and gloom written about the markets during the last 355 days, the warnings of impending financial Armageddon, the Hindenburg omens, the Omaha Titanic syndromes, the Gamma gravity, flips and flops, and other assorted esoterica, all the SPX did was to follow the seasonal pattern with uncanny accuracy:
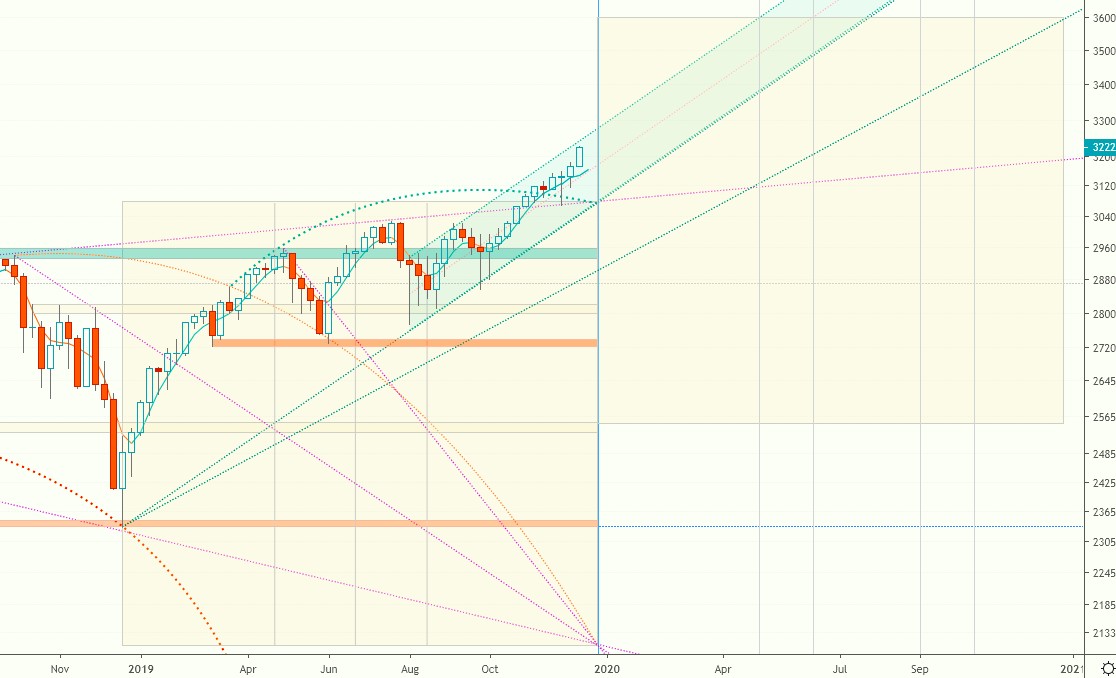
The SPX is likely to finish 2019 above our upside yearly target. However, the risk profile for 2020 is less bullish. Therefore, we’ll be keeping a close eye on the bottom of the uptrend channel for any signs of weakness and trend change:
We’ll update the key pivot, support/resistance levels at the beginning of 2020.
Current signals: Daily Long, Weekly Long.
The projected trading range for the SPX in 2020 is 2560-3600.
Enjoy the holidays!
For Oil, Gold and G6 weekly targets and Buy/Sell pivots, check the TV page which gets updated on Monday.
*Please ...
more
For Oil, Gold and G6 weekly targets and Buy/Sell pivots, check the TV page which gets updated on Monday.
*Please note that the signals are provided for informational purposes only. They are in effect as of the close on Friday and may change as soon as the markets re-open.
Charts, signals and data courtesy of OddsTrader, CIT for TradingView and NinjaTrader 8
For intraday charts and update follow us on TradingView
Disclaimer: Futures and forex trading contains substantial risk and is not for every investor. An investor could potentially lose all or more than the initial investment. Risk capital is money that can be lost without jeopardizing ones’ financial security or life style. Only risk capital should be used for trading and only those with sufficient risk capital should consider trading. Past performance is not necessarily indicative of future results.
less
How did you like this article? Let us know so we can better customize your reading experience.


