
SPDR S&P 500 Trust ETF: Trend Indicators Looking Stronger
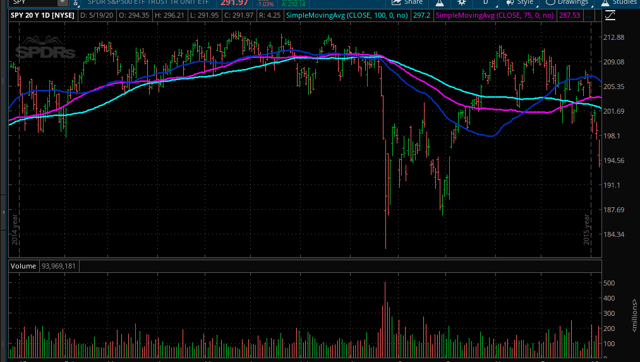
SPDR S&P 500 Trust ETF (SPY) is at a critical juncture. After a sharp crash and a vigorous but partial recovery, the ETF is trapped in a sideways range over recent weeks. This kind of indecision in the price action makes sense when considering the fundamental landscape.
(Click on image to enlarge)
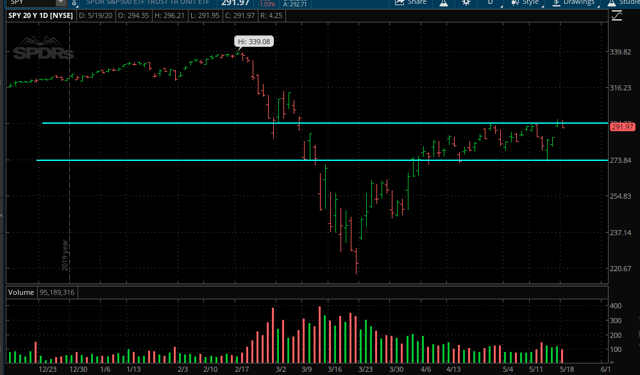
Source: TOS
The economy is in a deep recession, and we still don't know how long it will take to get back to something more similar to a new normal.
Personally, I am inclined to believe that things will go better than expected over the next 6 to 12 months. This is mostly because human beings tend to be too pessimistic during hard times, and we are clearly going through hard times. When - as opposed to if - the coronavirus gets under control, the economy and the stock market should benefit from enormous pent-up demand and unprecedented fiscal and monetary stimuli combined.
But anything can happen in the short term, and the market is clearly vulnerable to the downside if the reopening process doesn't go well in the next few weeks.
Imagine trying to forecast how SPY will move in the near term. The process would imply something like forecasting the evolution of the coronavirus and the measures to contain it, the overall impact on economic activity, how this will be reflected on earnings for the companies in the SPY portfolio, and what level of valuation investors would be willing to pay for those earnings. Good luck with that, you are going to need it.
Even the most renowned experts and investment banks fail time and again when trying to make these kinds of forecasts, and the chances of making an accurate prediction are even smaller than usual in the current environment.
The good news, however, is that you don't need a crystal ball to make smart risk management decisions in the stock market. As opposed to trying to forecast the future evolution of SPY, following the price trends can be a much sounder and more effective approach for risk management.
Don't Make Predictions, Follow The Trend Instead
Nobody has all the right answers in the market, but asking the right questions is much more important. Many investors are permanently wondering about what the market will do next when instead they should be asking how they will protect their capital through the unavoidable ups and downs in the market.
In essence, trend following means applying a trend indicator to an ETF such as SPY and only buying when the ETF is above such a trend indicator, meaning that the price is in an uptrend. For illustrative purposes, the chart shows the evolution of SPY and its 50-day moving average as a trend indicator.
(Click on image to enlarge)
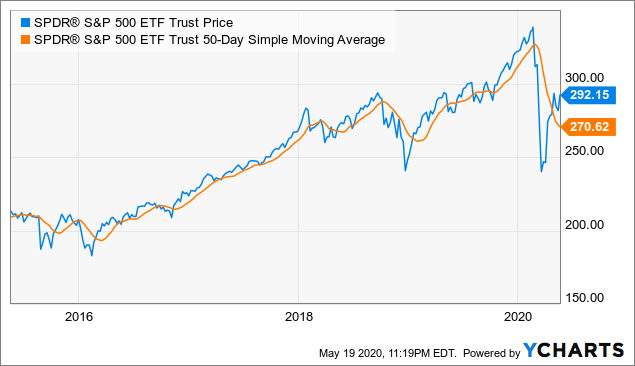
Data by YCharts
Trend following doesn't involve any prediction whatsoever, you just observe the current trend and invest accordingly. Performance from trend-following strategies will obviously vary from time to time, but the historical evidence shows that these strategies can be remarkably effective at optimizing returns and reducing downside risk over the long term.
The table below is from a research article from Alpha Architect entitled Trust The Process. We begin with the historical returns and risk metrics for US stocks, international stocks (EAFE), T-bonds, REITs, and commodities from 1973 to 2017.
(Click on image to enlarge)

Now, we can take a look at the risk and return statistics for these asset classes when applying a trend following strategy to them.
(Click on image to enlarge)

The main takeaway is quite clear, trend-following strategies can increase returns in many cases, and they do a great job in terms of reducing downside risk across all the asset classes examined over the long term.
Different Time Frames, Different Signals
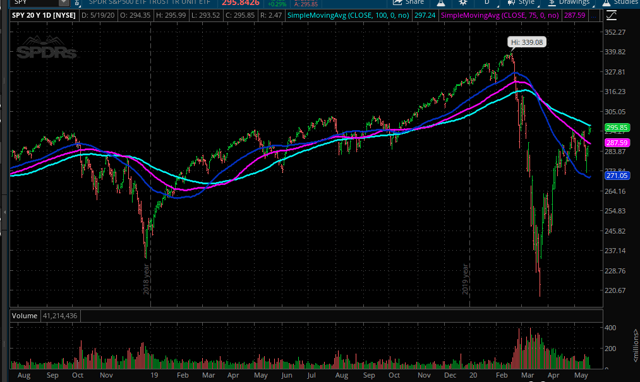
The chart below shows the evolution of SPY with two different trend indicators: The 20-day moving average as a short-term trend indicator and the 200-day moving average as a long-term trend indicator.
As we can see, there is a material difference in the kind of signals that these moving averages provide. The short-term moving average is much faster and sensitive, which has many advantages in terms of getting out of the market and then back in again without any delays. However, this short-term indicator is also noisier and more prone to false signals.
The 200-day moving average, on the other hand, is much slower and more robust. The long-term indicator doesn't provide as many false signals as the short-term indicator, but it takes a longer period of time for the 200-day moving average to react to changing market conditions.
(Click on image to enlarge)
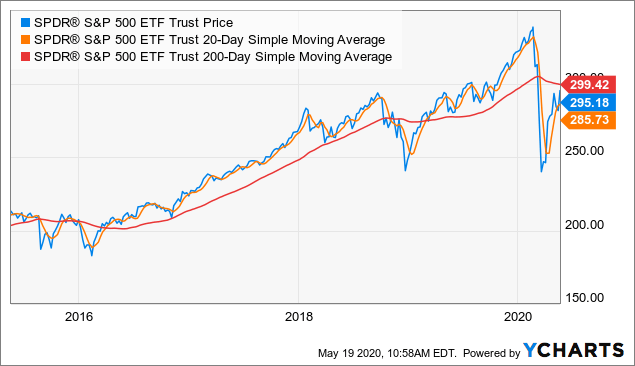
Data by Data by YCharts
This is an unavoidable trade-off when using moving averages as a trend indicator. A short-term moving average is much better in terms of speed, but a long-term moving average is superior when it comes to reliability and robustness.
This is the nature of the game, and it is important to understand that no indicator is necessarily better than the other, it all comes down to finding the right time frames for your own style and time horizon. Even better, combining different time frames can make a lot of sense in order to follow the trends over multiple periods.
The Triple Trend Model For Spy
The triple trend model for SPY is a quantitative strategy based on three different moving averages: 50, 75, and 100 days. We can imagine 3 different portfolios, each of them following a different moving average. When the trend is up the portfolio is allocated to SPY, and when the trend is down the portfolio is allocated to the iShares 7-10 Year Treasury Bond ETF (IEF) for safety.
(Click on image to enlarge)
Source: TOS
After that, we build a combined portfolio that is allocated 50% to the 50-day moving average portfolio, 25% to the 75-day moving average portfolio, and 25% to the 100-day moving average portfolio.
In simple terms, when SPY is above the 50-day moving average, 50% of the total portfolio is allocated to SPY. Then we allocate an additional 25% based on the 75-day moving average and the remaining 25% based on the 100-day moving average. The share of the portfolio that is not allocated to SPY always goes to IEF.
There is no magic involved in the moving average lengths or in the portfolio weights. You can perfectly well use different moving averages or weight the portfolios differently. This is just a combination of values that can make sense to assess the trend indicators for SPY over the medium term.
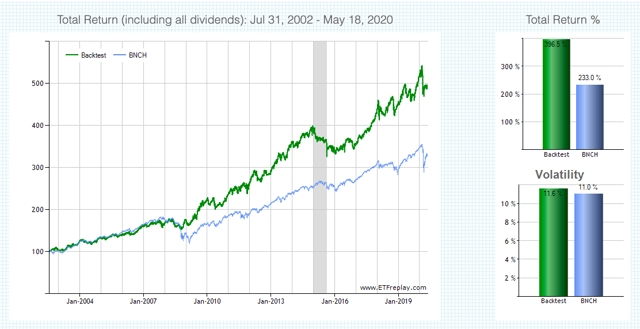
The backtest calculates the total return of the combined portfolio since July 31, 2002. The strategy is rebalanced monthly, so you just need to check the position of SPY versus the different moving averages and make the allocation decisions accordingly at the end of the month. The benchmark is a global 60/40 portfolio.
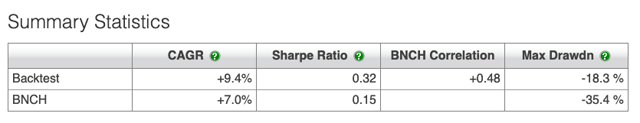
The triple trend model in SPY has done a solid job in terms of both risk and return over the years. Cumulative return is 396.5% for the strategy versus 233% for the benchmark. In annual terms, the strategy made 9.4% per year versus 7% per year for the benchmark.
(Click on image to enlarge)
Source: ETF Replay
More importantly, the maximum drawdown - meaning maximum capital loss from the peak - was -18.3% for the triple trend strategy applied to SPY versus 34.4% for the benchmark.
Source: ETF Replay
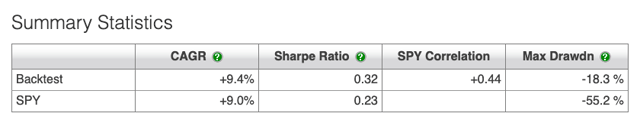
Even if we compare the triple trend strategy versus a buy and hold position in SPY, the strategy makes marginally higher returns at 9.4% versus 9% for buy and hold, but the benefits of reduced risk are substantial. The maximum drawdown for the strategy is -18.3% versus -55.2% for buy and hold investors in SPY.
Source: ETF Replay
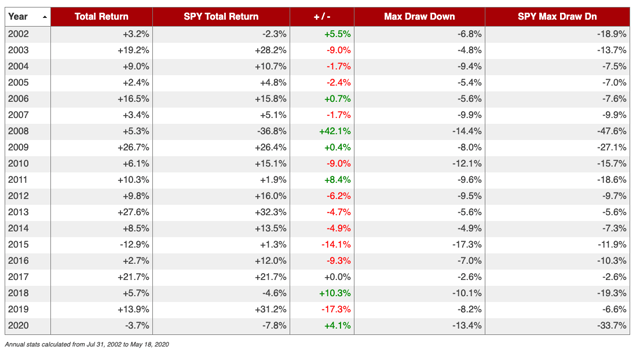
Looking at the historical performance for the triple trend strategy versus buy and hold investors in SPY over different years, it is important to note that the strategy even made positive returns in 2008, when stocks all over the world got clobbered. This is because the strategy was mostly allocated to IEF from December of 2017 to April of 2009, so it avoided most of the pain during the financial crisis.
Source: ETF Replay
The triple trend strategy had its worst year in 2015 when SPY had lots of sideways action and abrupt movements up and down. This is the worst possible environment for a trend-following strategy. When a trend is strong, either up or down, the strategy will most probably deliver solid returns by capturing those trends. But in a sideways market with lots of volatility, the strategy can be expected to produce lots of false signals and ultimately disappointing returns.
Source: TOS
Reading The Signals
More recently, the signals were remarkably effective at protecting the portfolio during the pandemic market crush. In March of this year, the triple trend strategy was fully allocated to IEF, and it gained 3.72% while SPY declined by a staggering 12.7% in a single month.
Source: TOS
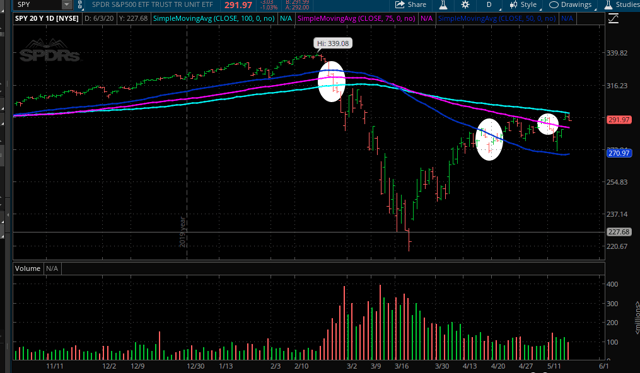
After SPY bottomed - at least temporarily - in the last week of March, the ETF crossed above the 50-day moving average in April and above the 75-day moving average in recent days, but not yet above the 100-day moving average. The triple trend strategy would currently be allocated 75% to SPY and 25% to IEF at current price levels.
In other words, the price action for SPY has been mostly stagnant in the past several weeks, but there have been some notable improvements from a trend-following perspective. Going forward, a break below $270 or so would be a major reason for caution, and a move above $300 would be a strong bullish signal for SPDR S&P 500.
Disclosure: I/we have no positions in any stocks mentioned, and no plans to initiate any positions within the next 72 hours.
Disclaimer: I wrote this article myself, and it expresses my ...
more

