
Despite a challenging 2025 marked by a 35% decline, Solana (SOL) has staged a surprising rebound, triggering a massive liquidation imbalance that has left short sellers scrambling.
Short sellers hit hard amid sharp rebound
Data from CoinGlass reveals that short-position traders have been disproportionately affected, with a liquidation imbalance soaring to 19,138%.
Over the past hour alone, shorts were wiped out by $300,110 as Solana briefly surged from $123.50 to a daily high of $126.57.
The unexpected resilience above critical moving averages has bolstered market confidence, while the Relative Strength Index (RSI) at 45.40 suggests that there is still room for upward momentum before the asset enters overbought territory.
Trading volume has also surged to $3.13 billion, indicating strong engagement from investors.
Analysts suggest that continued restraint from short-term profit-taking will be crucial if Solana aims to push toward the $130 resistance level before the year closes.
Technical levels suggest cautious optimism
From a technical perspective, Solana must hold above the key support at $123.35 to maintain momentum.
A sustained move above this level could open the door to the first major resistance at $137.65, with further upside potential toward $144.66 and $152.20.
Conversely, a break below $123.35 could expose the asset to a decline toward $110.57, underscoring the importance of these pivot points for short-term traders.
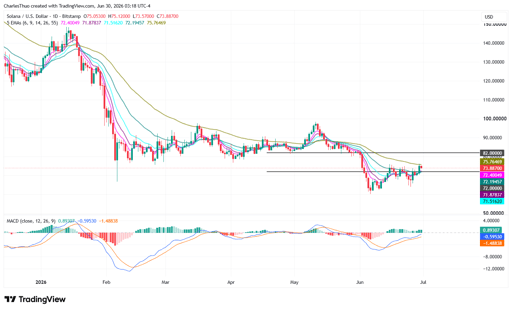
Recent price patterns show SOL navigating a descending wedge near $120, reflecting ongoing market pressure.
(Click on image to enlarge)

Solana price chart | Source: TradingView
Futures data indicate a bearish tilt, with short positions accounting for approximately 52.5% of open interest, which stands at $7.68 billion.
Despite this, institutional interest remains steady, with spot ETF inflows of $2.93 million daily, suggesting a measured but consistent demand that could support price stability.
The key levels to watch in January 2026
Current market data shows SOL trading at $125.58, down 43.9% over the past three months, with a market capitalization of $70.7 billion.
The 24-hour trading range of $123.60 to $126.86 highlights the coin’s volatility, while historical context reminds investors that SOL remains 57% below its all-time high of $293.31 recorded in January 2025.
The token’s immediate downside risk centers on the wedge support near $115.
Should the asset break this level, analysts anticipate tests of the S1 pivot at $107 and the April low at $95.
On the upside, surpassing the overhead trendline near $133 could trigger a rally toward the 50-day EMA at $137.
A breakout beyond these levels would signal a potential shift in sentiment and could set the stage for continued momentum into early 2026.
The combination of a pronounced liquidation imbalance, technical support levels, and mixed derivatives sentiment paints a nuanced picture for January 2026, where both caution and opportunity coexist for Solana traders.
More By This Author:
Shiba Inu Launches NFT-Based Recovery Plan After $4M Exploit
Liquidity Drain Causes Solana-Based USX Stablecoin To Depeg To $0.1
How Crypto ETFs Are Redefining The Crypto Market: Key ETFs To Watch Heading Into 2026


Comments
Log in or sign up to join the conversation.