Solana Crosses Above 66.00, And Cardano Above 0.430 Level
Solana chart analysis
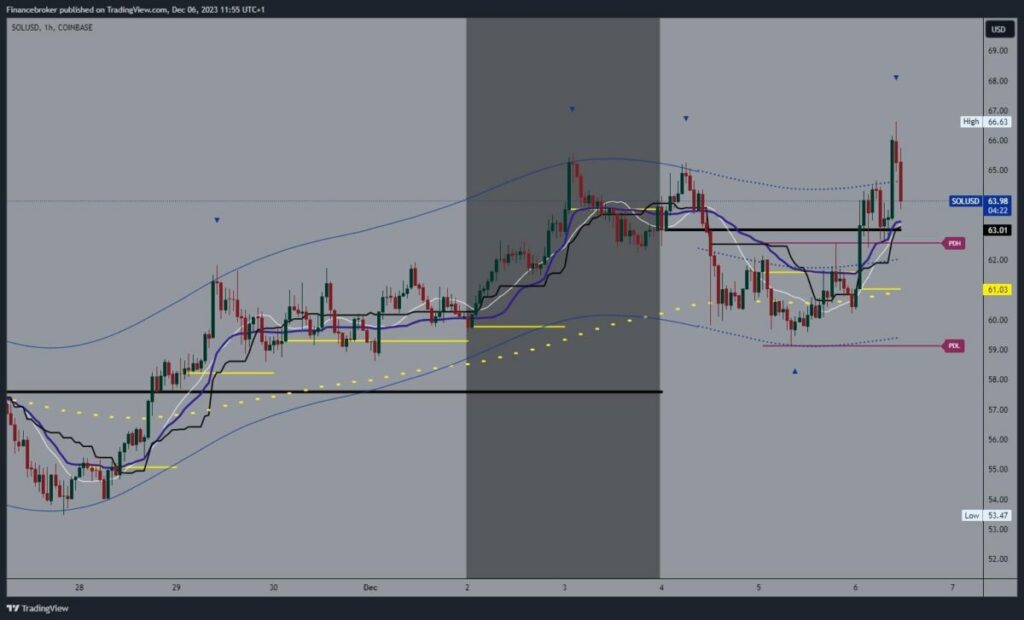
Today, we see a jump in the price of Solana up to 66.63 levels. In this way, we form this week’s new high, where we encounter resistance and retreat to the 64.30 level. The eyes are now fixed on 62.50, the previous support level, because if we fall below, we could start a deeper withdrawal of the price of Solana. Potential lower targets are 62.00 and 61.00 levels.
Additional price support could be found in the zone around 61.00 and the EMA50 moving average. We need a positive consolidation and return above the 65.00 level for a bullish option. After forming a new bottom at that level, we expect to see a continuation to the bullish side. Potential higher targets are 66.00 and 67.00 levels.
(Click on image to enlarge)

Cardano chart analysis
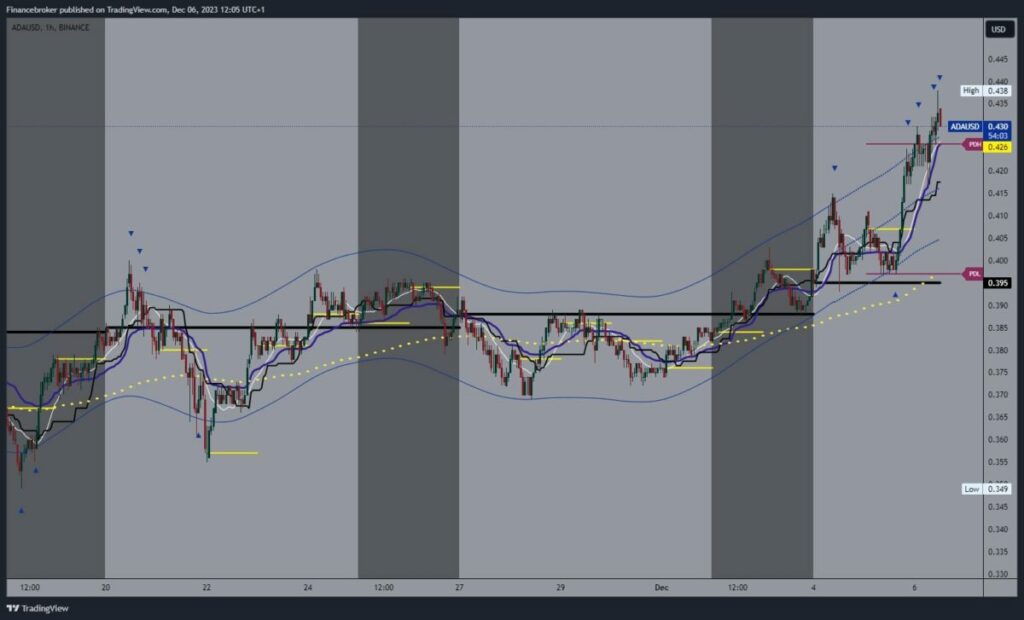
We are currently seeing a spike in the price of Cardano to a new December high at the 0.438 level. We remain very high above the 0.430 level, which could produce a new bullish impulse and a move to the upper levels. Potential higher targets are 0.440 and 0.450 levels. Thus, we would return to the movement zone from April.
We need a negative consolidation and price pullback below the 0.425 support level for a bearish option. We would look for the next one at the 0.420 level. A break below would increase bearish pressure to see a longer-term pullback to lower levels. Potential lower targets are 0.415 and 0.410 levels. The EMA50 moving average is in the zone around the 0.400 level.
(Click on image to enlarge)

More By This Author:
Bitcoin Is Above $44,000, And Ethereum Is At $2,300Oil Drops: OPEC+ Cuts And Middle East Tensions
Dogecoin Jumped Over 0.09200 And Shiba Inu Above 0.00000900
Disclaimer: Finance Brokerage and its workforce cannot, and do not, absolute warrant the accuracy, relevancy, reliability, consistency, and completeness of any information and materials in the ...
more


