Solana And Cardano: Solana Continues Recovery Above $155.00
Solana chart analysis
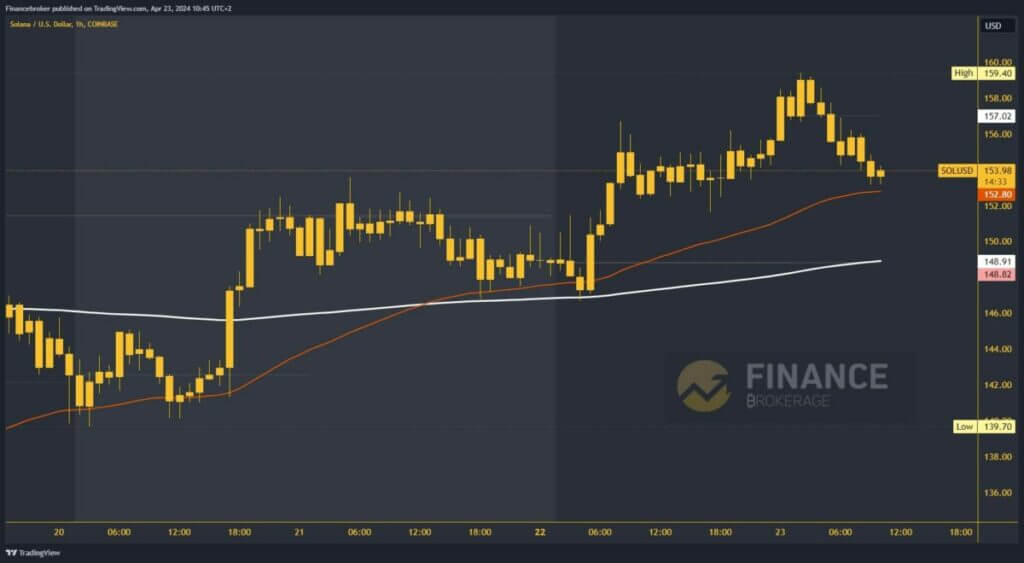
At the start of this week, the price of Solana continued with the previous bullish consolidation. A new high was formed this morning at the $159.40 level. After that, we are looking at a pullback to the $153.00 level, where we encounter the EMA50 moving average. Here we expect to receive new support and move again to the bullish side. Potential higher targets are $156.00 and $158.00 levels.
By falling below the EMA50 moving average, we could continue this morning’s retreat to a new daily low. Potential lower targets are $152.00 and $150.00 levels. Additional support in the $150.00 zone is the EMA200 moving average. We would look for support there again, just like yesterday at the start of this week.
(Click on image to enlarge)

Cardano chart analysis
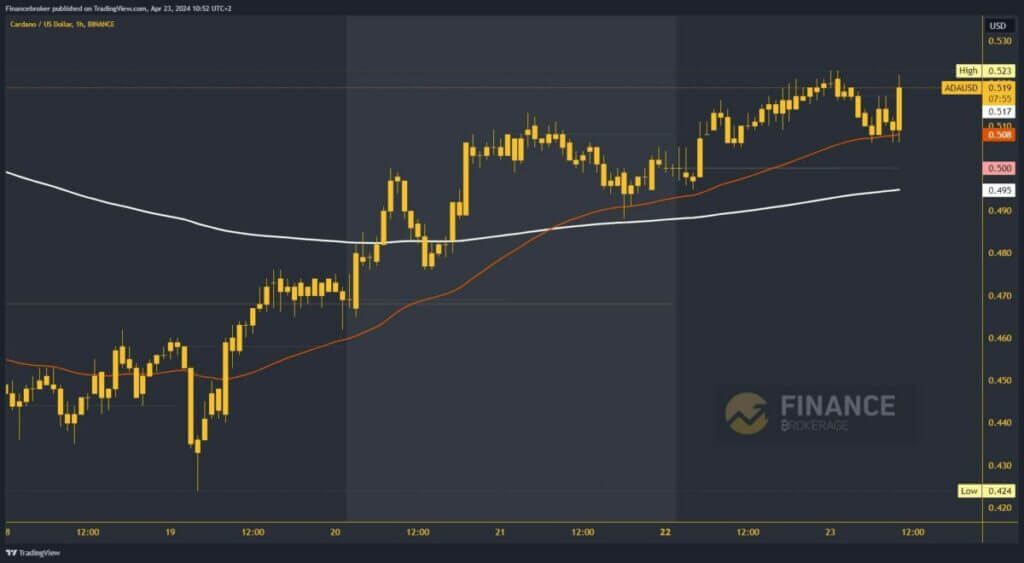
Cardano’s price climbed to a new 10-day high last night at the 0.523 level. After that, we saw a pullback to support at the 0.510 level. We have additional support there in the EMA50 moving average. A new bullish impulse from there takes us up to the 0.520 level again, and we are within reach of testing this week’s high. Potential higher targets are 0.530 and 0.540 levels.
We need a drop below the EMA50 and the 0.510 level for a bearish option. After that, we will test the weekly open price at the 0.500 level. If it does not hold, at 0.495, we look for support in the EMA200 moving average. The inability to hold even there will push us below to a new weekly low. Potential lower targets are 0.480 and 0.470 levels.
(Click on image to enlarge)

More By This Author:
Solana’s Market Value Plummets 31.96% In AprilOil And Natural Gas: Oil Falls Below Last Week’s Low
The Dollar Index Is Struggling With 106.00 Support On Friday
Disclosure: Finance Brokerage and its workforce cannot, and do not, absolute warrant the accuracy, relevancy, reliability, consistency, and completeness of any information and materials in the ...
more


