
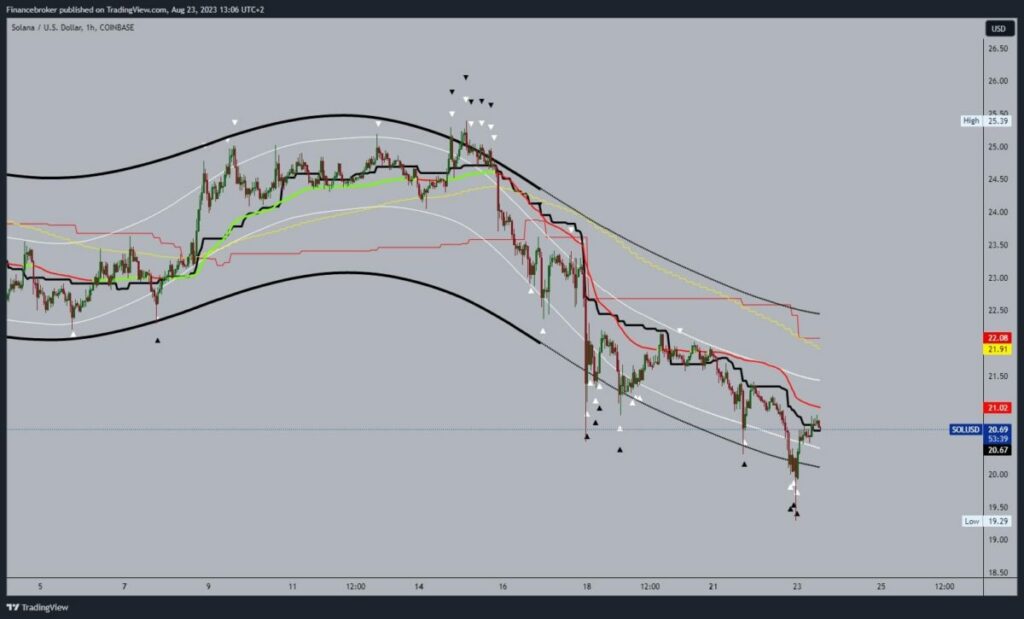
Solana chart analysis
Yesterday we saw a pullback in the Solana price to the 19.29 level. After that, the price consolidated and returned above the 20.00 level. Below, we see consolidation and recovery to the 20.80 level. Now we expect to see a break above to start a further recovery. Potential higher targets are 21.50 and 22.00 levels. We could have additional resistance in the EMA50 moving average around the 22.00 zone.
We need a negative consolidation and price decline to the 20.00 support level for a bearish option. A break below would mean we can expect to see a continuation to the bearish side. Potential lower targets are 19.50 and 19.00 levels.
(Click on image to enlarge)
Cardano chart analysis
Cardano’s price is recovering after this morning’s pullback to the 0.250 level. Today’s price high is 0.260, and for now, we are moving slightly below it. We need a break above if we want to continue the recovery. Potential higher targets are 0.265 and 0.270 levels. Additional support for Cardano is the EMA50 moving average in the zone, around 0.270.
We need a negative consolidation and pullback below the 0.255 level for a bearish option. After that, we can expect the price to visit the previous low at the 0.250 level again. A break below would reinforce the bearish flow and force the price to continue its retreat. Potential lower targets are the 0.245 and 0.240 levels.
(Click on image to enlarge)

More By This Author:
Dogecoin And Shiba Inu: Dogecoin Jumps To 0.06550 LevelBitcoin And Ethereum: Bitcoin Falls Below $25500 Last Night
Dogecoin And Shiba Inu: Dogecoin Is Hovering Around 0.06300


Comments
Log in or sign up to join the conversation.