
Ripple Price Forecast: XRP Getting Ready For A 50% Upswing As Consolidation Hits The Elastic Limit
Ripple’s overhead barriers are still in place, as highlighted on the 4-hour chart. The seller congestion at $0.3 is an uphill battle, so is the 50 Simple Moving Average. XRP/USD is trading at $0.27 amid extended consolidation. However, this sideways trading is approaching a breaking point to give way for the expected upswing to $0.4.
Ripple eyes massive liftoff to $0.4
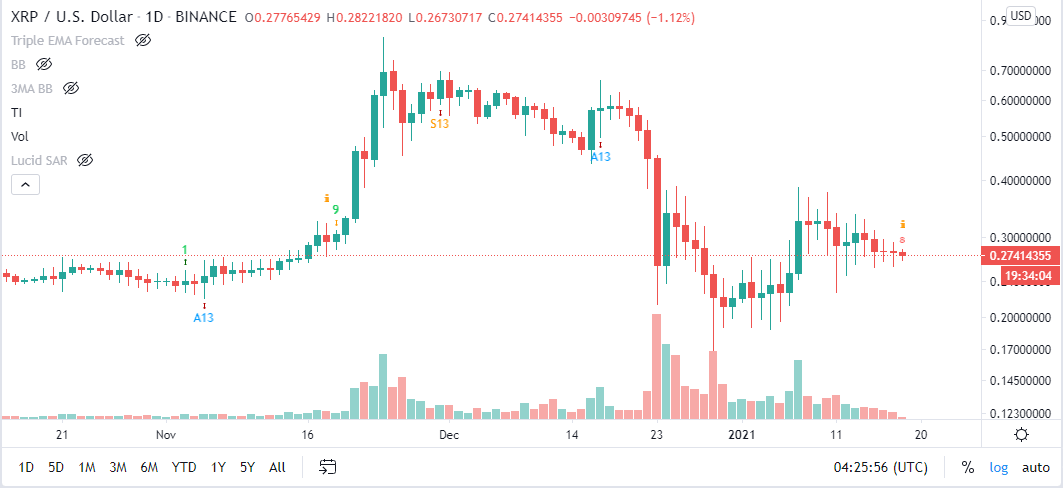
The cross-border token has continued to explore lower levels following the rejection at $0.3. XRP/USD seems to have entered a consolidation period that has forced the Bollinger bands to squeeze on its daily chart. Squeezes are indicative of low volatility periods and are usually succeeded by significant price movements. The longer the contraction, the higher the probability of a strong breakout.
This technical index does not provide a clear path about the direction of Ripple’s trend. As a result, the area between the lower and upper band is a reasonable no-trade zone. Only a daily candlestick close above or below this area will determine where the pioneer cryptocurrency is headed next.
At the time of writing, XRP is exchanging hands at $0.27 while struggling to stay above the Bollinger Band middle boundary. To sustain the uptrend, Ripple is required to close the above this critical level as well as the 200 Simple Moving Average on the daily chart.
(Click on image to enlarge)
%20(46)-637465417531137608.png)
XRP/USD daily chart
The moving average convergence divergence, or MACD, adds credence to the optimistic outlook. This technical indicator, follows the path of a trend and calculates its momentum, appears to be turning bullish within the same time frame after the 12-day exponential moving average crossed above the 26-day exponential moving average. For now, the odds for a bullish impulse have increased significantly.
A buy signal is likely to present on the daily chart in the coming few days. The call to increase positions in the cross-border token will manifest in a red nine candlestick. If validated, an increase in buying volume is likely to push XRP to higher levels above $0.3, thus paving the way for gains above $0.4.
(Click on image to enlarge)
XRP/USD daily chart
Santiment’s MVRV shows the average profit or loss of all XRP holders. The metric measure the relative change in the price of each token from the time it last moved. For instance, an MVRV with a figure of 2 suggests that all XRP are averagely at two times their initial investment.
At the moment, MVRV is below zero, which means that most of the holders are at a loss compared to the price of the tokens when they moved last. This is a substantial buy area as it indicates recovery is long overdue.
(Click on image to enlarge)
%20[07.34.05,%2018%20Jan,%202021]-637465417645044074.png)
Ripple MVRV chart
It is worth keeping in mind that Ripple may fail to rally as expected, especially if it fails to close the day above the middle boundary of the Bollinger bands and the 200 SMA. A surge in selling pressure may validate a breakdown towards $0.2, mostly if the critical support at $0.25 gets broken.
Disclaimer: Information on these pages contains forward-looking statements that involve risks and uncertainties. Markets and instruments profiled on this page are for informational purposes only ...
more


Thanks John. I thought the SEC was going after #Ripple though?
I finally bought some cryptocurrency for the first time... literally the day before this was announced!