Real Home Price Changes In Bubble Markets
(Click on image to enlarge)

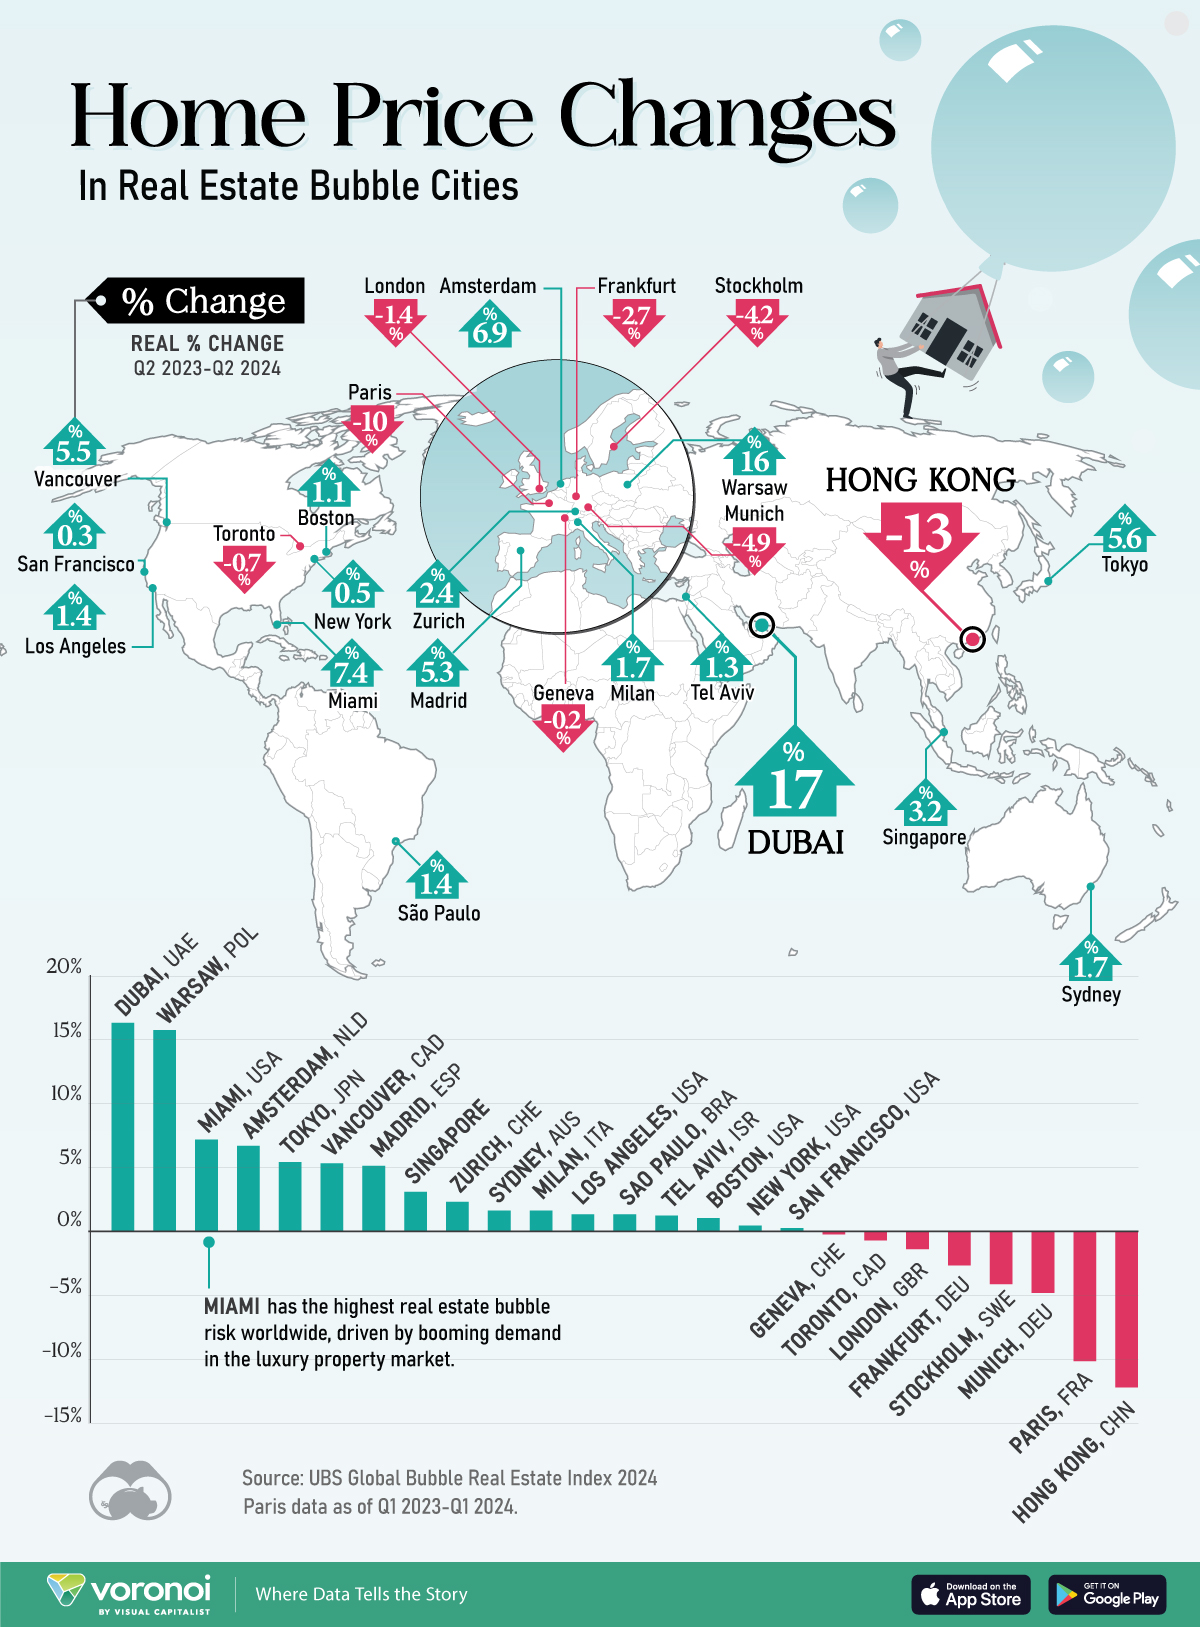
Since mid-2022, housing prices in the world’s real estate bubble cities have sunk approximately 15% in real terms as central banks embarked on rate hikes
Many European cities are experiencing the steepest declines amid stagnating population growth and weaker economic activity. On the flip side, bubble markets like Dubai, Miami, and Tokyo have seen sustained price increases driven by population growth and demand in the luxury sector.
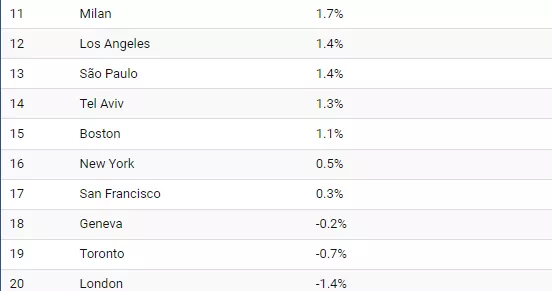
This graphic shows the annual change in real home prices across housing bubble cities, based on data from UBS’ Global Real Estate Bubble Index 2024.
Prices Diverge as Interest Rates Take a Toll
While high interest rates have cooled home prices in certain real estate bubble cities, others have shown remarkable resistance, leading to a diverse landscape across the 25 markets analyzed.


*Paris data as of Q1 2023-Q1 2024.
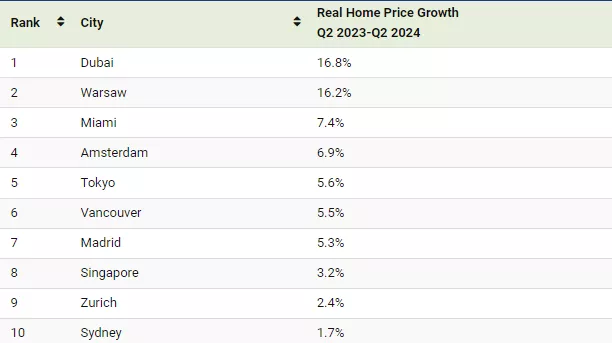
Dubai led the way with the fastest annual increase in real home prices, driven by an influx of residents attracted by its favorable tax policies, financial stability, and modern infrastructure.
Similarly, Warsaw saw double-digit growth in home prices, bolstered by government housing subsidies. In 2023, the government offered first-time homebuyers under 45 a 10-year 2% fixed-mortgage rate, with the government covering the difference between the 2% rate and the market rate.
In contrast, Hong Kong experienced a 13% annual decline, as weak population growth and sluggish demand pushed prices back to 2012 levels, in inflation-adjusted terms. Even against these headwinds, Hong Kong remains the most unaffordable city in the world, a position it has held for the last 14 years.
Meanwhile, Paris saw double-digit price drops, driven by lower transaction volumes, tighter bank lending, and high interest rates. Overall, European cities comprised six of the eight steepest price declines over the last year. Yet, prices across these cities may have bottomed out, especially if the European Central Bank continues to cut interest rates looking ahead.
More By This Author:
Ranked: Top Countries By GDP Per Hour
Mapped: Home Price-To-Income Ratio Of Large U.S. Cities
Charted: The Speed At Which New Technologies Go Mainstream
Disclosure: None


