Mr. Market Likes These 10 Good-Yielding Reasonable-Risk REITS. Should You?
Real Estate Investment Trusts (REITs) are great for income and asset-class diversification. Starting with the latter, this is a great way for investors to get exposure to real estate without having to jump through the operating hoops best left to those who pursue the field as a profession, and without having to treat their homes as if they were pork-belly futures. (Click here for an example of a well-reasoned discussion of the merits of REITs relative to investment via private equity funds.)
As to income, REIT yields tend to be well above those of corporate shares of comparable risk. But REITs can scare many investors, even well-read investors who find themselves confronted with unfamiliar terminology (FFO, AFFO, NAV, cap rate, etc.), suggestions that familiar basics such as sales, earnings and payout ratios, are irrelevant, and discussions that can leave you to wonder if you have to feel guilty about not being a developer.
Good news: Teaming up with Mr. Market (yes, that Mr Market, the mythological manic depressive trader invented by Ben Graham and later popularized by Warren Buffett), we can smash through such obstacles and take sensible steps toward earning unexpectedly high yields.

© Can Stock Photo, 8vfanC
The General Dividend-Safety Protocol
On 5/28/19, I described an approach to income investing that largely eschews conventional dividend-safety tests such as payout ratio and leans instead on three elements of market-based risk assessments:
- The yield itself: Look for high yields, but not too high since very high yields are caused by share prices that have been pushed down by investment-community fears that the dividend will soon be reduced or eliminated, We can debate forever about whether the market usually knows, but whatever we think about the big picture (in my view, it’s right more often than my ego used to allow me to believe), my experience and research over the years convinces me that Mr. Market is especially skilled at assessing dividend safety.
- Behavior of significant investment-community participants: The idea here is to look at what analysts, short sellers, insiders are saying and doing with respect to these stocks. I capture this through the “Expert Opinions” component of Marc Chaikin's Chaikin Power Gauge ranking system.
- Behavior of the investment-community crowd: This involves technical analysis, which uses price and volume trends to discern the sentiment of the not-nearly-as-ignorant-as-cynics-enjoy-assuming herd. I capture if through the “Technicals” component of the Power Gauge model.
If we assume Mr. Market knows what he’s doing, an assumption I’ve leaned (sometimes the hard way) to accept (absent stock-specific indications to the contrary), we’ll indirectly be taking into account textbook standard payout ratios, etc. and also qualitative judgments regarding company-specific oddities that make basic datas-points less useful than naive observers might realize (this actually happens a lot) as well as assessment for future dividend-paying capacity (historical data can take you just so far in a world in which past performance cannot be assumed to determine future outcomes).
The World of REITS
The accounting conventions that produce the data with which we’re all so familiar presume we’re looking at simple manufacturing companies (in business schools, the product is said to be “widgets” (If you’re wondering what widgets are, I think they are used to hunt snipe — if you’re confused, check Google). Any time we encounter a non-manufacturing entity, we’ll probably be looking at one that doesn’t mesh well with accounting for widgets, which means we need to invent different metrics and/or to interpret standard metrics in non-standard ways. REITs fall into this challenging category.
REITs own and/or manage real estate; land and buildings. The depreciation rules that apply to manufacturers don’t apply to REITs the same way. Slumlords aside, depreciation is relevant because property does age and need to be kept up to date (in manufacturing, depreciation is a ballpark estimate for annual capital spending). But the numerical profile is quite different from other kinds of physical assets. So REITs can typically devote a lot more of the cash associated with the non-cash depreciation expense to payment of dividends — which is why a payout ratio that looks shockingly high for most companies could be quite reasonable, even low for a REIT (REITs actually compute payouts relative to Funds from Operations, an unofficial but widely used industry measure of financial performance).
Another major issue is the balance sheet. Did you pay 100% cash for your house? Unless you’re a 1%-er type buyer typically depicted on the reality TV Million Dollar Listing franchise (“all cash, 30-day close” the buyer’s agent typically brags), you probably borrowed a lot of the funds and took a mortgage. Professional real estate works the same way. It’ expected that you will work largely with other peoples money (debt). This is acceptable because, pre-2008 idiocy aside, real estate loans can usually be comfortably covered by security in assets worth at least as much as and usually more than the amount of the loan. From the operator’s point of view, if you’re putting up all or most of the money, most will find it hard to work to enough scale to actually make for a real business. So with REITs, excess borrowing is as dangerous as it is for any other, but the thresholds that define excessive are much higher than they are for the typical manufacturer.
The typical company is always deciding how much profit to pay to shareholders as dividends or reinvest in future business growth. REITs can’t do that. They have to pay all their profits as dividends and finance growth with outside capital (new debt and/or newly issued equity). In return for doing this, REITs get to avoid paying any corporate taxes. (Note that they are REITs, not REICs; the T at the end stands for trust, in contrast to C for corporation). Uncle Sam gets his tax on that income from the shareholders. Now . . . The shareholders pay this tax at ordinary income rates rather than preferential rates applicable to “qualified dividends.” But economically, that’s more than fair — because the REIT was not taxed at all, it is able to distribute more than the corporation. Put another way, REIT dividends are taxed once — to the shareholder. Corporate dividends used to be taxed twice, once to the company and a second time to the shareholder but with the adoption of the preferential dividend rate, corporate dividends are now still taxed at more than 100%, but less unfair than the old200%.
This is not an exhaustive catalog of differences between REITs and corporations, but these items — the big ones — serve to illustrate the challenges of trying to apply conventional financial factors to this group. That means we either have to automatically exclude REITs from consideration, ditch the quant work and go the old-fashioned way (subjective), or adapt.
I believe there’s too much opportunity to simply scratch REITs altogether. Knowing the hazards of playing it by ear (emotion, bias, etc.), I really don’t want to turn the clock back. So theanswer: Adapt. One way to do that is to embrace the subjective but rather than trying to do it as a solitary genius, I prefer a wisdom-of-the-crowd type approach, which diversifies against any wackiness I or any individual might bring to the process by looking to the aggregate judgment of many. Logically,we should be used to this. We diversify all the time. Even efficient-market hardliners would have to take it seriously. After all, they’re the ones who’ve been preaching that the market knows.All they need to do to get aboard would be to back away from the extreme dogmatic view that the market knows absolutely positively everything to a more pragmatic view that the market knows a lot of things.
The Approach I Use Here
Using the Chaikin Analytics screener, I choose to screen on an industry (Real Estate in this case) and the two market-oriented Power Gauge categories, Experts and Technicals. For Experts, I require Bullish or Very Bullish ratings. For Technicals, I take a broader view and look for any rating equal to or better than. Neutral. (I need to screen twice; once with Bullish thresholds (which includes Bullish and Very Bullish) forboth Experts and Technicals, and a second version in which I keep Experts at Bullish and drop Technicals to Neutral. In all cases, I set the Yield rule to greater than 4%.
Testing this approach on Portfolio123, it looks like the ETFs identified by this screen produced more or less even with the benchmark during up-intervals, which I defined as the Vanguard Real Estate ETF (VNQ). But these ETFs have a yield advantage over the Vanguard offering (which clocks in a bit below 4%) and during down periods, the ETFs produced by this screen exhibited a tendency to noticeably outperform the benchmark, especially when I added another requirement that the rank on the Long-Term Debt to Equity factor (part of the “Financials-Value” Power Gauge category) be no worse than neutral.
If this were 5-10 years ago and benchmark Treasure interest rates still had a good gap between themselves and zero, I might try for a more aggressive screen, one that tested better under bullish conditions. But given where we are in the interest-rate cycle and given how strongly REITs have performed of late, managing downside risk seems a worthy endeavor.
Selecting Individual REITs
As I went through the 30 REITs thusly uncovered, I did so with the following principles in mind.
- I’m not a fan of mortgage REITs (those that lend money rather than own/manage properties; these tend to have higher yields but as wannabe-but-less-regulated banks, they, for the most part, have more risk than I want to take).
- I eliminated the highest yields; in this market, 8% is the level above which I start feeling queasy.
- The long-term debt thing is tricky. Because, as noted, REITs are debt heavy, it will be hard for many, if any, to rank really well in this factor. I’m also inclined to leave this put out of the final set of screens and use it as a consideration as I go through the list of passing REITs. Unless something else really caches my eye, my preference would be to avoid REITs ranked at the absolute bottom in this category.
- Finally, I’ll also consider the usual start-at-the-bottom-and-move-up method of examining the overall presentation (the overall Power Gauge, Relative Strength, Overbought-Oversold, Money Flow, and the in-chart indicators).
The REITs I Chose
Here are the REITs that seem most interesting to me. They are presented from high-to-low in order of yield (and based on the yield sequence, we should infer higher to lower in terms of risk as well).
CorEnergy (CORR), yield 7.52%
MLPs, publicly tradable partnership entities engaged in oil and gas transport (pipelines, terminals, etc.) are not new to those who seek yield. What is new, with CorEnergy, is use of the REIT rather than MLP business structure. In other words, CorEnergy is not in the energy business; it’s a landlord to energy companies and the money paid by the latter under their net leases are operating exposes associated with renting assets, not capital costs associated with investment in assets they own. That means that CorEnergy still collects even if a “tenant” is in bankruptcy. (Bankruptcy can cut off payments of capital costs, but the process doesn’t mess with day-to-day operating expenses.) The dividend here is well covered by the basic portion of rent (as opposed to the extra portion that represents participation in tenant revenue). That this is the top-yielding choice here indicates Mr. Market is not expecting much, if any, growth. In fact, on a long-term basis (count in decades), acquisitions will be needed to offset depletion. But this is a known issue and, given that the yield is so high relative to other kinds of landlord risk, suggests it’s already priced into the stock. And by the way, if you own this REIT in lieu of an MLP, your accountant is less likely to direct homicidal fantasies in your direction, as they might if/when K-1s start coming in.
Summit Hotel Properties (INN), yield 6.17%
As its name and ticker suggest, Summit is a hotel REIT. More specifically, it’s in the “select service” segment of the business, meaning its not like a motel, that gives lodgers the barest minimum, nor it like a full-service hotel, where guest rates necessarily include the costs of fancy amenities many may or may not care about. Picture something like a bar and bare-bones table service as opposed to an upscale restaurant. This puts room prices at what’s often a sweet spot between luxurious and spartan. Debt is modest by REIT standards and the dividend payout ratio (as a percent of the REIT-oriented Funds From Operations) metrics is a very comfortable 58%. Sure the hotel business is cyclical, but there’s cushion here in terms of debt and payout. It helps, too, that if lodgers must scramble to compete for guests, a large portion of Summit’s properties are affiliated with well-known, well-respected brands (such as Hyatt, Hilton, Marriott, and IHG) with loyalty programs and sophisticated ubiquitous reservation systems.
Vereit (VER), yield 5.86%
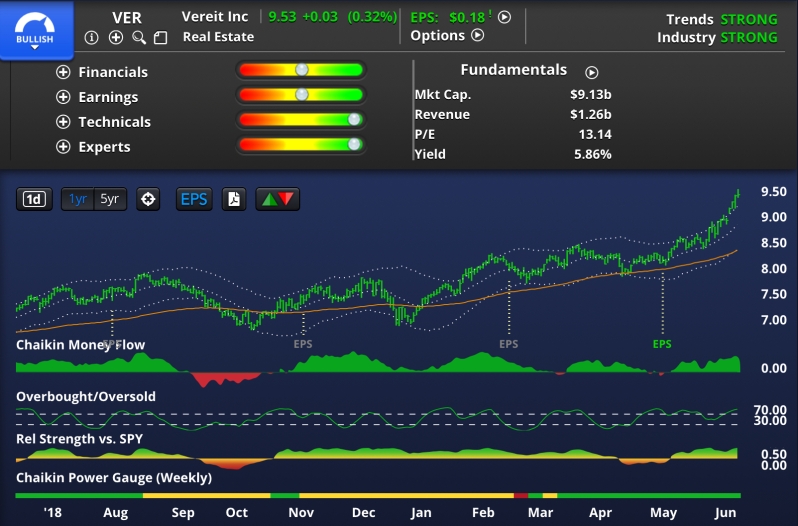
I’m really, really putting myself in Mr. Market’s hands with this one, something I’d not have done 30 years ago, when I still thought I was smarter than the world and before I accumulated enough experience to help me realize I’m not all that. This is about as good a classic bull situation as I’ve come across in the income category; bullish rating for overall Power Gauge bullish stock personality (relative strength), bullish money flow, a price pattern that’s jumped above everything (Resistance? Where was that?), and a short-term overbought condition (well, I never said “perfect” and given the way this indicator bounces up and down, its the easiest “defect” to forgive). So what might I be whining about if my younger more know-it-all self were doing this writeup? Vereit is a single tenant net lease REIT (I like that) that’s well diversified across property types, which sounds great but being well diversified means you’re going to touch on things that might not be your ideal choice, such as free-standing retailers like Bed, Bath & Beyond (its seen better days) and restaurant operators. And, by the way, there was an accounting blow-up in 2014, but theres new management here now and even a new name (Vereit relates to the Latin word for “truth”). So why might Mr. Market be smarter than my inner neurotic? If you’re going to be in real estate, then you need to be in real estate and if you’re in, its a fantasy to assume you can dodge every bullet (just like with stock portfolios) and this outfit has a well diversified portfolio. Also, it’s not overly debt heavy (by REIT standards) and the yield, based on the well covered dividend, is high — but not so high as to come close to “sucker yield” levels.
Easterly Government (DEA), yield, 5.64%
Do you hate the notion of a bloated federal bureaucracy and wish to heck it will somehow get under control and be slimmed down? Who doesn’t! Do you believe it will ever happen? LOL! So what’s a disgruntled citizen to do? Why not try the old adage “If you can’t beat ‘em, join ‘em.” That’s what you would be doing if you own Easterly, which rents buildings on a net lease basis to federal agencies which, electoral-candidate spin aside, are not shrinking. There is, of course, no law that says the feds must rent rather than own. But the average age of federally-owned building is about 50 years and we all know how many workplaces built 50 years ago have become obsolete. And agency operating officials, who know even better than we know how hard it is to get things done in the public sector, are suffering a lot less when they choose to rent new space as opposed to buy or build.It’s no picnic for landlords either. That’s an edge for Easterly, which is used to dealing with all this The dividend has been stationary of late, as the REIT has been paying out as much as it really can. But with a yield like this on a business as stable as this, we can live with stationary and regard any future growth we get as icing on the cake.
Spirit Realty (SRC), yield 5.61%
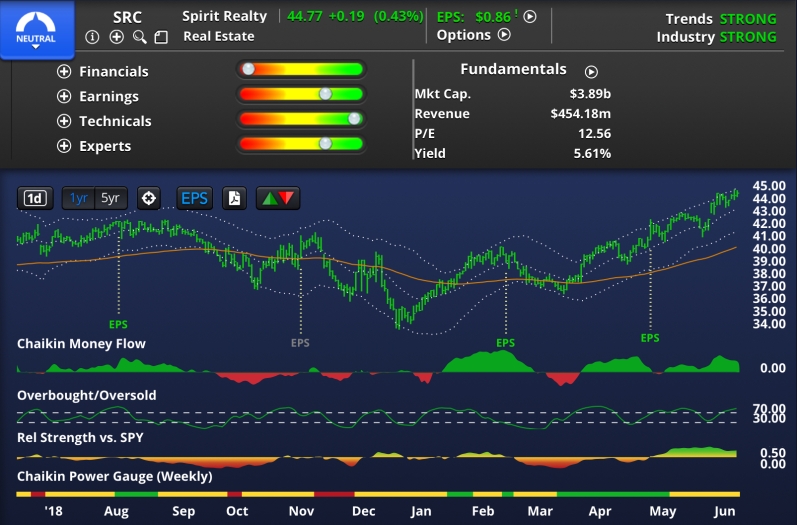
The last couple of years have been quite eventful for Spirit. Skipping the gory details, this REIT, under the stewardship of a new CEO who took the helm in 2017, disposed of assets (mainly an external management arrangement with Spirit MAT REIT. What’s left now is a pure-play net lease REIT with a tenant portfolio consisting of 31% traditional retail, 59% service retail (entertainment, medical, restaurant, drugstore, etc.), 7.6% industrial and the rest “other.” I’m not thrilled to death with traditional retail (Who is nowadays?) but Sprit’s tenant base includes a high proportion of investment grade and publicly-owned tenants. Mr. Market, however, which sees all the same information. You can see it too, by clicking here. (By the way, if you do click on that presentation, check pages 24-29 for an interesting discussion of Sprit’s proprietary analytics platform, which it uses to assess potential returns and risk in ways that are analogous to what a lot of equity portfolio managers do.) The yield (and implied risk) rank in the middle of this group and the stock has been pushing vigorously higher breaking through rising trend lines and on strong-enough volume to result in strong money-flow metrics. The stock’s “personality” recently changed from bearish to bullish and its now tapping at a recently-raised resistance level.
Bluerock Residential (BRG), yield : 5.46%
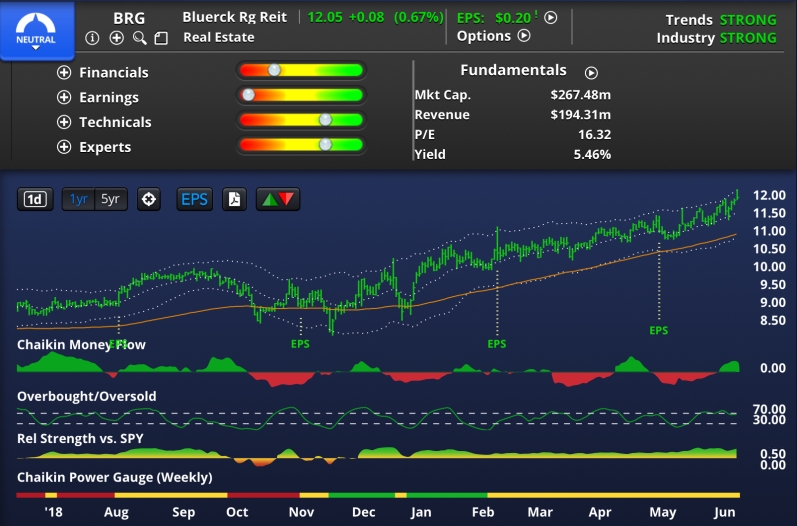
Shares of Bluerock, a REIT that focuses on rentals of multifamily housing, show a nice technical pattern (a series of rising highs and rising lows with the price having just nudged pasta resistance point again. Money flow and stock personality are both bullish. The overall Power Gauge rating is neutral, which is acceptable to me since, it’s hard for REITs, given their distinct financial profiles, to get bullish scores. And as per my screening, BRG is fine in the two sub-ranks on which I focused here. Debt leverage is high even by REIT standards, but I (and, obviously, Mr. Market) can accept it given good fundamentals. The market for multifamily rentals is healthy given job growth, household formation, and affordability challenges in the ownership market, which are likely to worsen if/when mortgage rates rise form still-relatively low levels, Bluerock renovates to keep its properties fresh and appealing and sticks to southern knowledge-economy markets.
Front Yard Residential (RESI), yield 5.08%
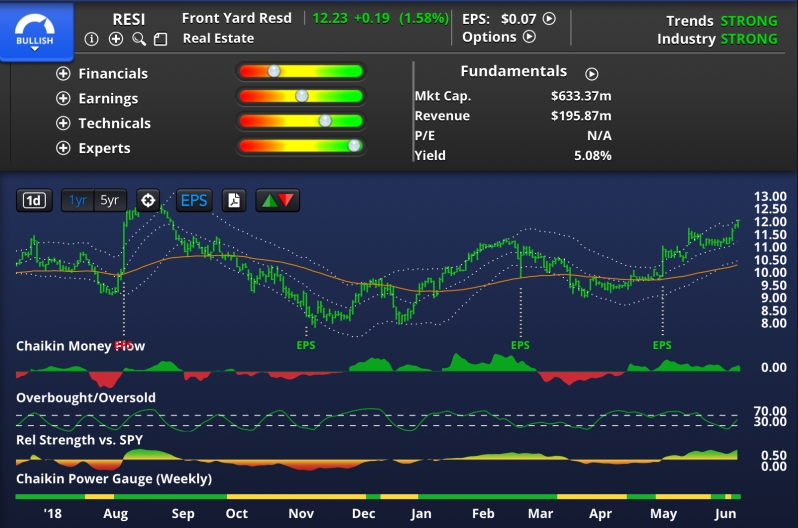
Front Yard Residential (RESI) is another REIT that benefits from strong trends in the rental market. In contrast to Bluerock, Front Yard focuses on renting single-family houses in suburban areas. This is an interesting niche: According to Front Yard, only 15 million (out of 85 million, 17.6%) of single family homes are occupied by renters, and only 1% of the rented homes are managed institutionally. This suggests good opportunity for growth via acquisition. Meanwhile, the stock is looking more like a classic bull setup. Besides the recently-turned-bullish overall Power Gauge rating, the bullish personality, the bullish money flow and the up trending stock price, the uptrend has been sufficiently non-frantic to have produced an oversold reading. Like BRG, though, debt leverage here is high even by REIT standards, but I agree with Mr. Market about its acceptability in light of business prospects.
STAG Industrial (STAG), yield 4.63%
STAG is the only pure-play industrial property REIT in this list. Specifically, it consists of single-tenant properties. That this stock’s yield is at the lower end of the yield/implied risk says something about Mr. Market’s assessment of the diversity of the portfolio in terms of territory and business type, with a healthy dose of businesses that actually benefit from e-commerce, an especially warehouse-intense business. Within the industrial field, STAG emphasizes secondary markets where the supply-demand balance tends to be more favorable for property owners (tight availability encourages tenants to renew leases) with a smattering of larger primary markets. The company avoids the supply-heavy super-primary markets, which were hitharder in the last down-cycle.
Community Healthcare (CHCT) yielding 4.36%; and Healthcare Trust of America (HTA), yielding 4.33%
These two healthcare REITs serve a market that is being and is likely to continue being pushed forward by strong demographic tailwinds related to the aging population, which spurs greater demand for all kinds of healthcare services. Still, we should not be naive: Even when flying with tailwinds, we can hit some nasty air pockets and in this area, those are likely to stem from issues with insurance reimbursement, where rates aren’t always as favorable to providers as they might wish, or even need. As with the dreaded clear-air turbulence, these reimbursement crises can come and go in hard to predict way. At present, skilled nursing is catching the bumps. But it could be something else down the road. This is why I’d prefer to approach this area through a package deal: Own both Community Healthcare and Healthcare Trust of America together, or neither. Each ETF is well diversified within the healthcare orbit (medical office buildings, outpatient surgery centers, hospitals, substance abuse facilities, skilled nursing, senior living, etc.). This, along with the demographic push, likely explains the comparative lower yields and risk profiles. Given that the property-type concentrations of these REITs differ, the combination enhances diversification.
Disclosure: None.


