Median Household Income In April 2022
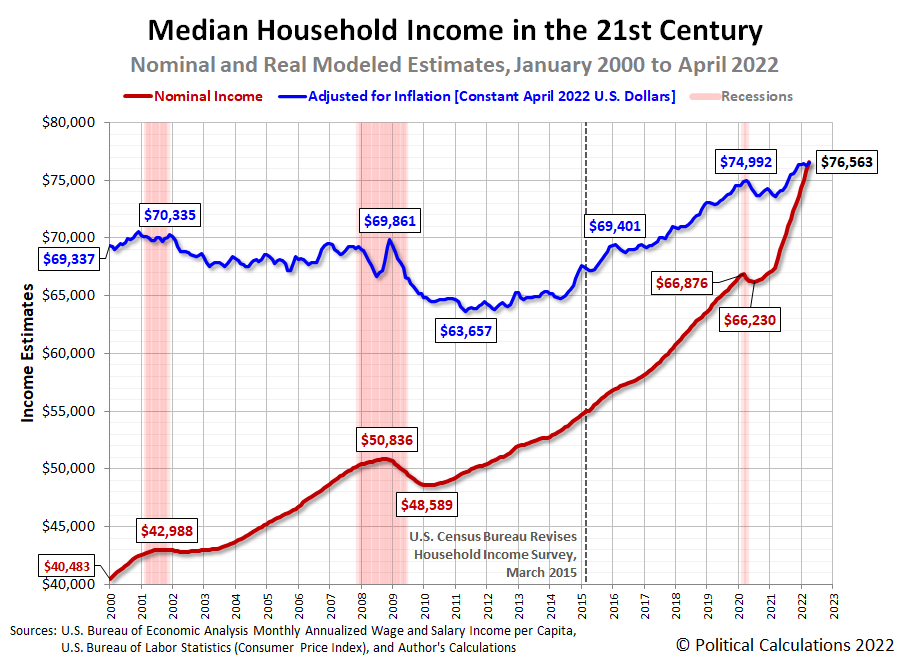
Political Calculations' initial estimate of median household income in April 2022 is $76,563, an increase of $1,024 (or 1.36%) from the initial estimate of $75,539 in March 2022.
The latest update to Political Calculations' chart tracking Median Household Income in the 21st Century shows the nominal (red) and inflation-adjusted (blue) trends for median household income in the United States from January 2000 through April 2022. The inflation-adjusted figures are presented in terms of constant April 2022 U.S. dollars.
The pace of inflation slowed from previous months in April 2022. Adjusted for inflation, median household income rose by $299 from March 2022's revised estimate of $76,264 in terms of constant April 2022 U.S. dollars. Inflation eroded nearly 71% of the nominal month-over-month gain for American households.
Analyst's Notes
The BEA significantly revised its aggregate wage and salary data upward for the six months preceding April 2022. The adjustments affected the estimates for October 2021 (+0.4%), November 2021 (+0.7%), December 2021 (+0.8%), January 2022 (+0.8%), February 2022 (0.8%), and March 2022 (+0.9%).
References
U.S. Bureau of Economic Analysis. Table 2.6. Personal Income and Its Disposition, Monthly, Personal Income and Outlays, Not Seasonally Adjusted, Monthly, Middle of Month. Population. [Online Database (via Federal Reserve Economic Data)]. Last Updated: 27 May 2022. Accessed: 27 May 2022.
U.S. Bureau of Economic Analysis. Table 2.6. Personal Income and Its Disposition, Monthly, Personal Income and Outlays, Not Seasonally Adjusted, Monthly, Middle of Month. Compensation of Employees, Received: Wage and Salary Disbursements. [Online Database (via Federal Reserve Economic Data)]. Last Updated: 27 May 2022. Accessed: 27 May 2022.
U.S. Department of Labor Bureau of Labor Statistics. Consumer Price Index, All Urban Consumers - (CPI-U), U.S. City Average, All Items, 1982-84=100. [Online Database (via Federal Reserve Economic Data)]. Last Updated: 11 May 2022. Accessed: 11 May 2022.
Disclosure: Materials that are published by Political Calculations can provide visitors with free information and insights regarding the incentives created by the laws and policies described. ...
more


