Charted: The U.S. Mortgage Rate Vs. Existing Home Sales

The U.S. Mortgage Rate vs. Existing Home Sales
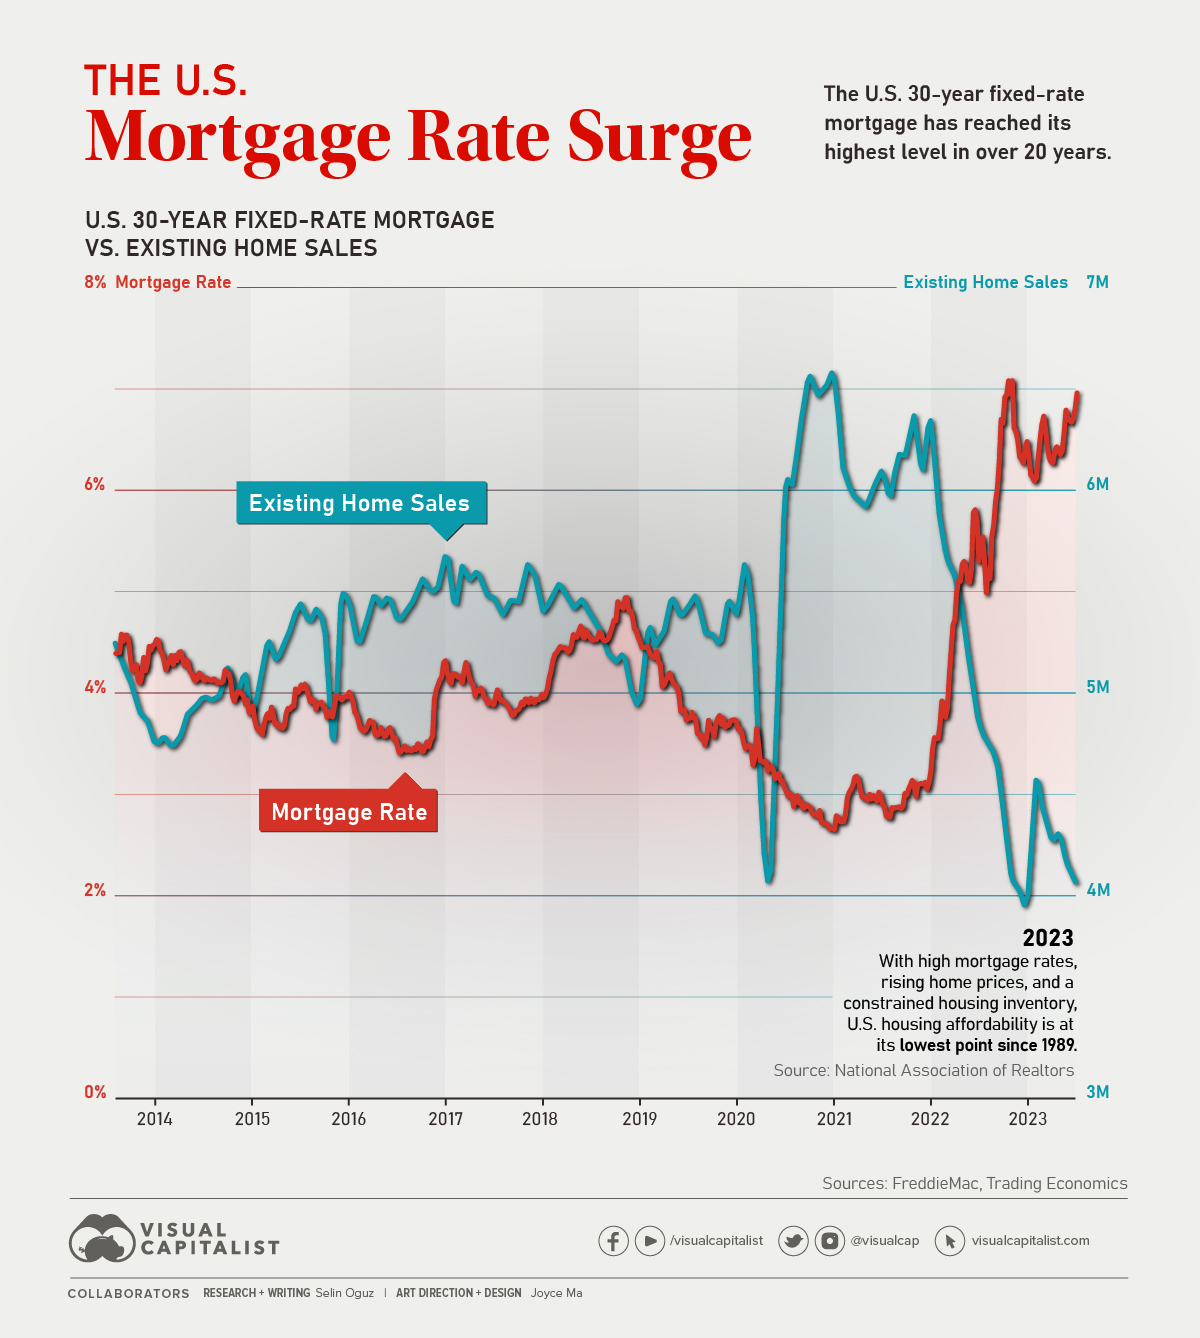
The U.S. 30-year fixed-rate mortgage has reached its highest level since 2002.
Coupled with rising home prices and a constrained housing inventory, U.S. housing affordability is now at its lowest point in history, according to the National Association of Realtors.
In the graphic above, we take a closer look at how the U.S. 30-year fixed-rate mortgage has evolved since 2013 against the backdrop of existing home sales, using data from both Freddie Mac and Trading Economics.
A Decade in Review: U.S. 30-Year Fixed-Rate Mortgages
Due to the stability and predictability they offer, fixed-rate mortgages remain very popular among American homebuyers. In 2021, 30-year fixed-rate mortgages made up 70% of all issued mortgages in the country.
Let’s take a look at how U.S. 30-year mortgage rates have evolved through the years.
| Year | Average 30-Year Fixed-Rate Mortgage |
|---|---|
| 2023 (Year-to-Date) | 6.65% |
| 2022 | 5.34% |
| 2021 | 2.96% |
| 2020 | 3.11% |
| 2019 | 3.94% |
| 2018 | 4.54% |
| 2017 | 3.99% |
| 2016 | 3.65% |
| 2015 | 3.85% |
| 2014 | 4.17% |
In the last few years alone, Americans have seen 30-year fixed-rate mortgages hit their lowest point in U.S. history—2.65% in January 2021—as well as skyrocket to their current rate of 7.31% (as of October 3, 2023.)
Naturally, this surge may leave many people wondering about the reasons behind this drastic change and whether they will drop any time soon.
Why Do Mortgage Rates Rise?
Mortgage rates rise in response to various economic indicators and policy changes.
Over the years, factors such as shifts in the Federal Reserve’s monetary policy, inflation concerns, the state of the bond market, and fluctuations in economic growth have all played roles in influencing mortgage rates.
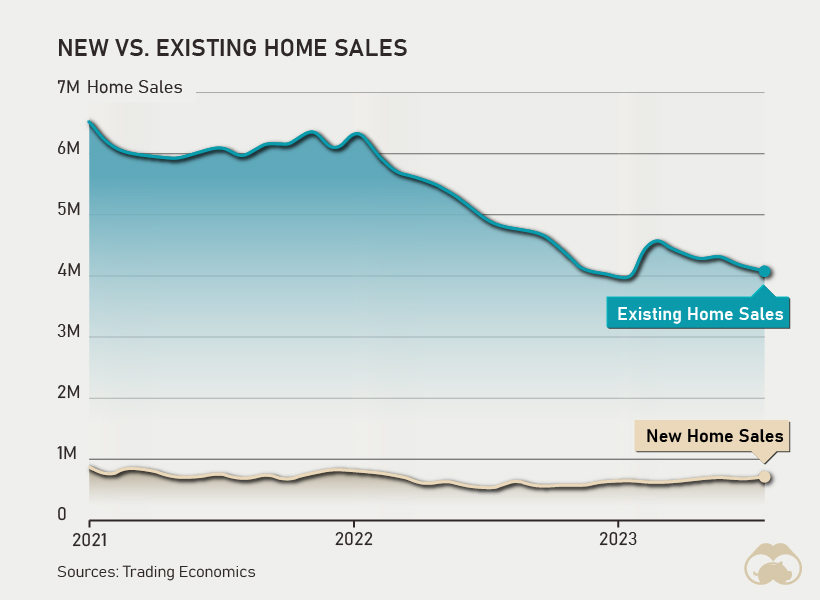
2023 is no different, with many different economic and global events at play. It’s also notable that these high mortgage rates are affecting home sales in the U.S., specifically with existing home sales taking a dip while new home sales subtly rise.

This change in dynamics is occurring as homeowners with low mortgage rates hesitate to sell their homes and get back in the market amidst high mortgage rates. In turn, demand from buyers is increasing new home sales and pushing prices even higher.
What’s In Store for U.S. Mortgage Rates?
U.S. mortgage rates remain above 7% for the time being. However, experts suggest that rates may have already peaked and will likely start to fall in the coming months as recession fears subside and the economy regains its momentum.
The Mortgage Bankers Association estimates that the U.S. 30-year fixed-rate mortgage will fall to 6.3% by the end of 2023 and 5.4% by the end of 2024. Based on these predictions, it’s likely that the rates that characterized 2020 and 2021 will not be returning for some time to come, despite their downward trend.
More By This Author:
All Of The World’s Exports By Country, In One ChartWill The U.S. Get Hit With A Recession In 2024?
Ranked: The Most Carbon-Intensive Sectors In The World
Disclosure: None


