
Post-CPI, November 17
Below is a summary of my post-CPI tweets.
- CPI consensus is for a “soft” 0.2% on core. With 2 of the last 3 months quite low for one-off reasons, I am a little skeptical.
- Rolling off an 0.196% m/m core from Oct 2015. Need about 0.23% to get y/y to tick back up to 2.3% on core.
- Wow, 0.1% m/m on core and y/y goes DOWN to 2.1%! But not as impressive as that. To 3 decimals it’s 0.149% and 2.144%. Still, soft.
- The doves just got another bullet.
- Component breakdown very slow coming in….bls hasn’t posted data yet.
- The overall number doesn’t mean much without the breakdown…still waiting on BLS.
- Well, this is anticlimactic. BLS just not putting up the data. No data, no analysis.
- Looks like a sharp fall m/m in some medical care commodities, but BLS report itself only gives 1-decimal rounding and no y/y comparisons.
- BLS a half hour late now. Wonder if they’re all in “safe spaces” today.
- Well, I see one reason. Apparently the BLS made an error in prescription drugs and actually revised all of the indices back to May.
- …including the headline NSA figure. That’s an error with huge implications. It means the Tsy made wrong int payments on some TIPS.
- NSA was 240.236, 241.038, 240.647, 240.853, and 241.428 for May-Sep. Now 240.229, 241.018, 240.628, 240.849, 241.428
- Market guys telling me Tsy will use the old numbers for TIPS and derivatives. And hey! Look at that. BLS decided to release figures.
- Gonna be an interesting breakdown actually. Surge in Housing and jump in Apparel, but plunge in Medical Care, Rec, & Communication.
- Core services 3% from 3.2% y/y, core goods -0.5% from -0.6%.
- OK! Housing 2.87% from 2.70%. BIG jump. Apparel 0.68% from -0.09%. Medical 4.26% from 4.89%. All big moves.
- Primary Rents: 3.79% vs 3.70%; Owners’ Equiv Rent 3.45% vs 3.38%. Lodging away from home 4.37% vs 3.73%. All big jumps.
- In Apparel (@notayesmansecon ), Women’s 0.27% vs -0.35%, but it was 1.57% 3 months ago. Girls tho: 3.06% vs 1.95%, vs -4.73% 3mo ago.
- In Med Care: Drugs 5.24% vs 5.38% ok. Med Equip -0.79% vs -0.61% ok. Hospital Svcs 4.06% vs 5.64% !, Health Ins 6.93% vs 8.37% !.
- Median should be about 0.16%, but median category looks like Midwest Urban OER so there’s seasonal adj I am just estimating.
- That would keep Median at 2.49%, down from 2.54%. But all this looks temporary.
- Core ex-housing dropped to 1.20%, lowest since last Nov. But it was as low as 0.87% last year.
- Here is the summary: Rent of Shelter continues to rise, and actually faster than our traditional model. Services ex-Shelter decelerated.
- Core goods continues to languish. But here’s the thing: Housing is stickier than the rest of Core Services.
- So unless somehow hospital prices just started to drop, this isn’t as soothing as the headline.
- That said, this is the most dovish Fed in history. If the market continues to price 90+% chance of hike, they will…but…
- …but if we get more weak growth figures, the 2-month moderation in inflation will be enough for them to wait one more meeting.
- Employment numbr is key. Meanwhile, infl is going to keep rising. Housing worries me. Higher wages might keep housing momentum going.
- Here are the two categories that constitute 50% of CPI. Housing and Medical Care. Not soothing.

- Here’s another 30%. Volatile categories we usually look through.
- Last 20% of CPI are these 4 categories. They’re the ones to watch. Nothing too worrisome yet.

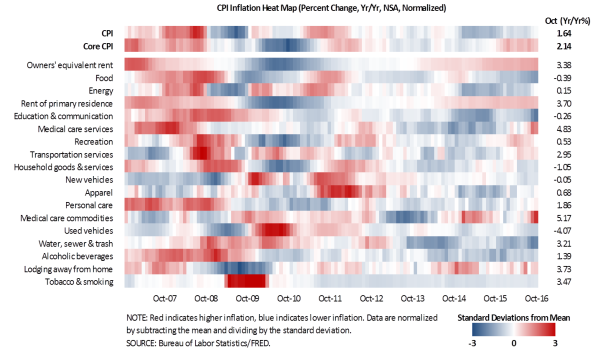
- Here’s the FRED inflation heat map. Yeah, these were all charts that were SUPPOSED to be in my de-brief.
- Compare distributions from last month (smaller bar on far left) and this month (bigger bar on far left).

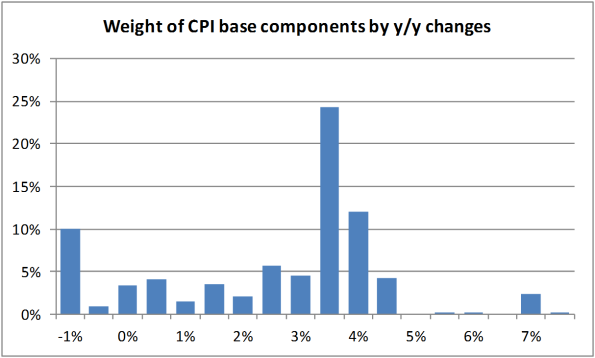
- More negatives, but some of the longest bar shifted higher too. More dispersion overall.
I keep coming back to the housing number. That jump is disturbing, because most folks expected housing to start decelerating. I thought it would level out too (though at a higher level than others felt – roughly where it is now, 3.5% on OER, but it’s showing no signs of fading). Here’s the reason why. It’s a chart of a model of Owners’ Equivalent Rent:
This nominal model is simply the average of models based on lags of various measures of home prices. We were supposed to level off and decline some time ago…but certainly by now. And so far there’s no sign of that.
Our model is a bit more sophisticated, but if you rely on lags of nominal variables you’re going to get something like this because housing price increases have leveled off (that is, housing prices are still rising, but they’re rising at a constant, and slightly slower, rate than they were).
Now, here’s the worry. All of these models are calibrated during a time when inflation in general was low, so there’s a real chance that we’re not capturing feedback effects. That is to say, when broad inflation rises it pushes wages up faster, and that tends to support a higher level of housing inflation. We have a pretty coarse model of this feedback loop, and the upshot is that if you model housing inflation as a spread compared to overall or core inflation, rather than as a level, you get different dynamics – and dynamics that are more in tune with what seems to be happening to housing inflation. Now, it’s way too early to say that’s what’s happening here, but with housing at our forecast level and still evidently rising, it’s time to start watching.
Disclaimer: Be sure to look at our Crowdfunder equity raise: https://www.crowdfunder.com/enduring-investments-llc … The ...
more

