Overheated Housing Markets - Part 2
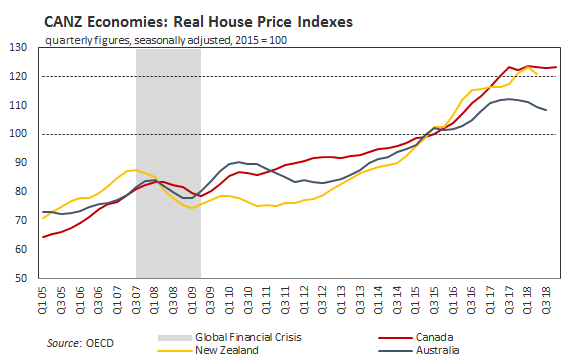
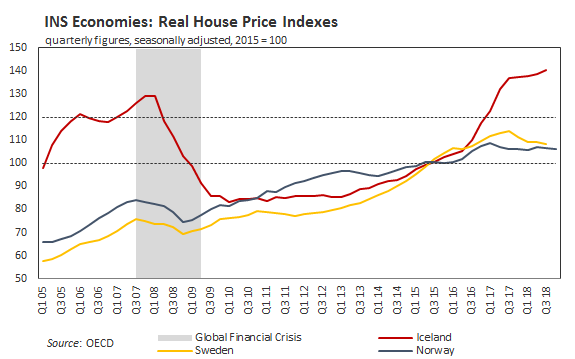
First, a correction: In my prior post on overheated housing markets, I switched the index values for New Zealand and Norway on the charts. I also said the index values are compared to their long-term trend, which is not correct. They have the year 2015 as their base or reference date (2015 = 100). If one uses the value of 120 (20%) or higher as a measure of overvaluation, then the housing markets in Canada, New Zealand and Iceland are overvalued. Latest data for Canada and Norway is Q4 of last year, Q3 for Australia, Sweden and Iceland, and Q2 for New Zealand. Below are the correct charts for the real house price indices.


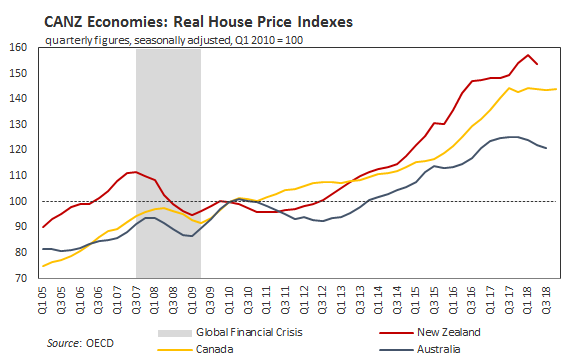
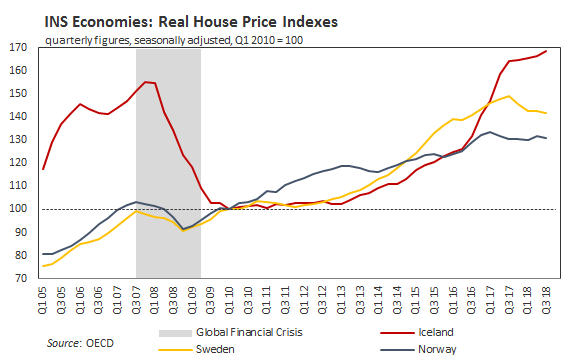
As I mentioned earlier, the fall in house prices in Iceland was much more extreme when the GFC hit the country and it was not until Q1 2010 the prices found the bottom. In next two charts I have re-indexed the house price indices to that date. All six indices are above their 120-level mark, with Iceland and New Zealand having their house prices up 68% and 54% from first quarter 2010.


Disclosure: The analysis provided here is usually part of the analysis the author uses when he is designing and managing his investment portfolios.
Disclaimer: The analysis presented ...
more


