

Image Source: Unsplash
Nike recently reported stellar earnings. The company beat by an incredible 43%. The stock crashed anyway. Most traders watching CNBC scratched their heads. Meanwhile, our community walked away with 140% overnight.
I want to show you what you can learn from this, and how you can be ready for the next big trade. Let’s walk through the progression.
The Setup
On Tuesday at 3:38 PM, right before the close, someone made a bet. Not a small one. It was 7,200 put contracts at the $64 strike. Nike was trading at around $66. Earnings were scheduled shortly after the close on Wednesday.
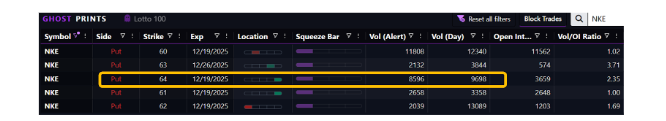
This wasn't speculation on bad numbers. This was institutional capital positioning for downside. The kind that knows market maker hedging dynamics create self-fulfilling pressure.
It was one of several put option prints, but there was one massive signal. The timeline had begun.
The Pressure Builds
The day of earnings brought more conviction. Another 8,360 puts at the $60 strike. Price paid: $0.36 per contract.
Combined with Tuesday's activity, over 20,000 put contracts accumulated in two days. Between the $64 and $60 strikes. All bought, not sold. All positioned for downside before Nike's after-hours announcement.
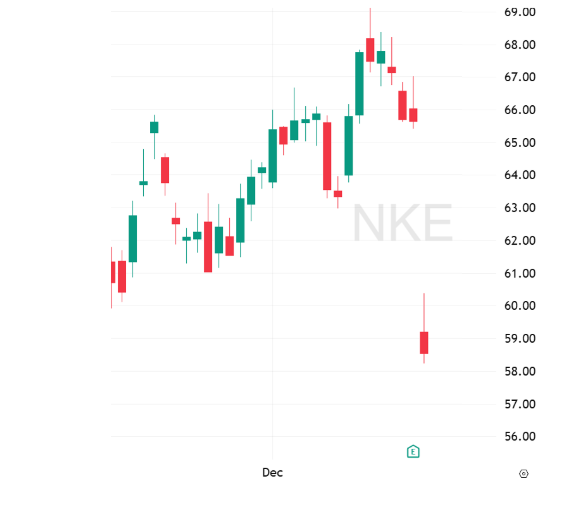
Market makers selling those puts had to hedge. They had to short the stock. Based on the chart, that should have been no big deal. There was a nice uptrend in place. But the gamma mechanics were building massive downside pressure beneath the surface.
The price hadn't moved yet, but the trap was set.
The Trade - Navigating Volatility Skew
Here's where most traders would have stumbled. To get this trade right, you had to pay attention to the skew. That might sound like black magic, but it is really just the difference in implied volatility across multiple strikes.
If implied volatility is getting higher as the strikes go further out-of-the-money, that means something. And that's something we have to pay attention to. It’s like the difference between the cost of premium brand ice cream and the store-brand stuff. At some point, you’re going to simply say “no” to your favorite Ben and Jerry’s flavor no matter how good it is. The price matters.
Nike's volatility skew was brutal. Implied volatility sat above 130%. Put verticals were mis-priced. Buying one strike and selling another meant paying too much for the long side and getting too little for the short side.
The solution: a butterfly spread that neutralizes skew. Here's the structure:
- Buy the $63 put
- Sell two $61 puts
- Buy the $59 put
Cost: $0.25 for a $2 wide butterfly. Maximum profit potential: $1.75. The risk was clearly defined, and the target clearly identified.
This wasn't about betting on some catastrophic collapse. This was about positioning for a move to $61, right in line with the expected move and the institutional put strikes. This was executed on Wednesday afternoon, one day to expiration. That's classic earnings butterfly timing.
Thursday Morning - Reality Hits
Nike reported after the bell on Wednesday. The numbers looked good: $0.53 per share versus the $0.37 expected. A massive beat was recorded.
Thursday's opening price was $59. It turns out, investors don’t like it when you sell 21% fewer shoes in your second biggest market and then admit you don’t have a solution in mind.
The stock gapped down seven dollars despite beating earnings. The gamma effect in full force. Market makers who sold those 20,000 puts had to hedge aggressively. That hedging created selling pressure that overwhelmed any positive earnings sentiment.
The butterfly spread opened inside its profit zone. Price bounced from $59 to $60.35 as the morning progressed. That's the time to exit.
The position was closed at $0.63 from an entry point of $0.25. An overnight return of 140% was the result.
The Lesson - Magnitude Over Direction
This trade teaches something critical about our Ghost Prints method. The prints don't predict earnings results. They reveal positioning that creates magnitude when the price moves in the gamma direction.
Micron also reported the same week. The company crushed earnings estimates by $1.30. The stock moved exactly 1x the expected move higher. No gamma pressure. No acceleration.
Nike beat earnings. The stock moved greater than the 1x expected move lower. Gamma pressure amplified the downside. These prints gave us four things:
- Symbol: Nike (NKE)
- Direction: Downside bias from massive put accumulation
- Target: $60-$64 strike zone
- Timeframe: Through Friday's expiration
The trade structure handled the rest. The butterfly spread neutralized the volatility skew problem. Risk stayed small at $0.25. Meanwhile, the profit potential stayed asymmetric at 7:1.
What This Means For Your Trading
Our Ghost Prints aren't magic, they're mechanics. When institutions accumulate 20,000 put contracts before earnings, market makers create downside pressure through hedging. If earnings disappoint or even just fail to exceed elevated expectations, that pressure accelerates the move.
You don't need to predict the earnings result. You need to position for the amplified move if it develops in the gamma direction. The Nike case study shows this perfectly. Good earnings, bad reaction. Our method revealed the positioning two days early. The butterfly spread captured the move with defined risk.
Most traders read headlines after the fact and wonder what happened. Our members saw it building in real-time and thus positioned accordingly. The difference between watching and participating starts with seeing what institutions are doing before the crowd catches on.
More By This Author:
2026: A Year For The Consumer ComebackThe Ice Cube Is Melting: Here's What Happens Next
Bullish Trades Cost 50% More

Comments
Log in or sign up to join the conversation.