

Image Source: Unsplash
It may seem like a quaint notion to a new generation of YOLO-inspired speculators, but options markets arose as a way to transfer and hedge risk. When we view options pricing data for some outperforming stocks, we see that FOMO is the main risk that is being hedged.
The key to the prior assertion involves understanding the concept of options “skew”.[i]When we plot the implied volatilities of each options strike for a given expiration, they typically show a non-linear output. It is normal to see a curve with a low ebb at market or slightly above market, with higher implied volatilities prevailing for below-market options than for those of similarly above-market options. Below is a graph showing skews for S&P 500 (SPX) options for the next three monthly expires. The skews are relatively typical for a given stock or index:
Skews for SPX Options Expiring on April 19th (lilac), May 16th (yellow), June 20th (orange)
(Click on image to enlarge)
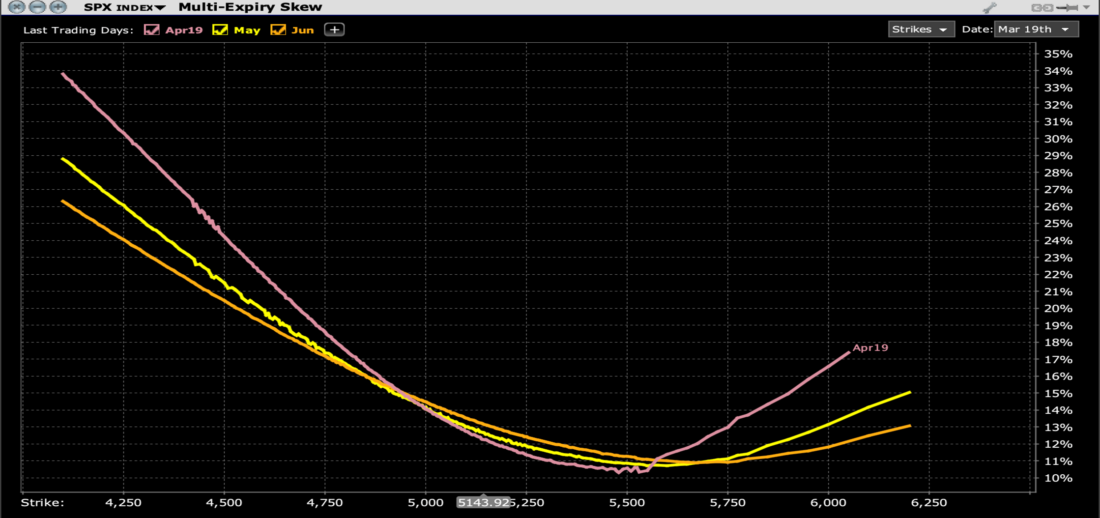
Source: Interactive Brokers
Now, let’s compare that to the same set of skews for Nvidia (NVDA). The differences are stark!
Skews for NVDA Options Expiring on April 19th (yellow), May 16th (orange), June 20th (red)
(Click on image to enlarge)
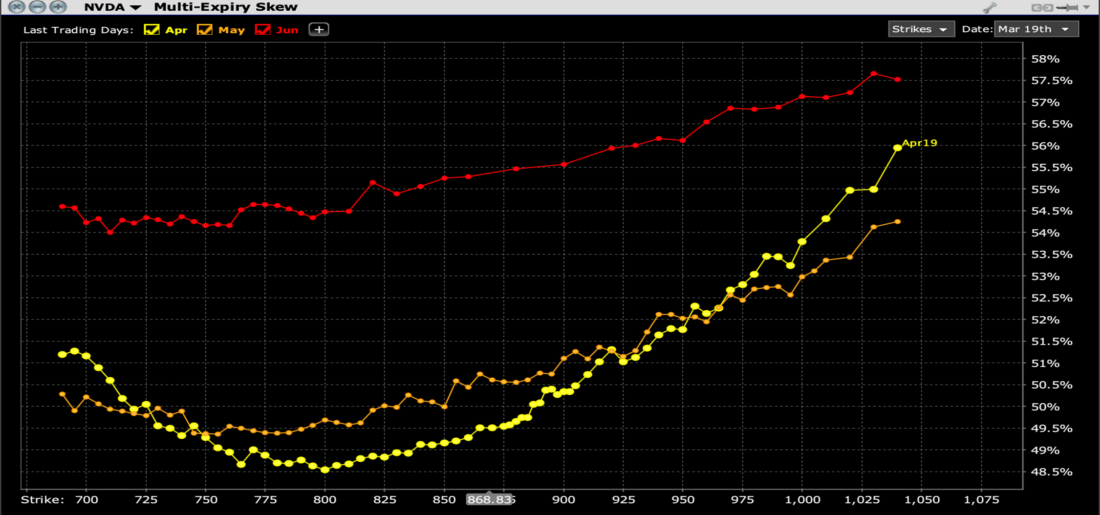
Source: Interactive Brokers
By the way, the odd skew is not unique to NVDA. Here is the same skew chart for AMD:
Skews for AMD Options Expiring on April 19th (yellow), May 16th (orange), June 20th (red)
(Click on image to enlarge)
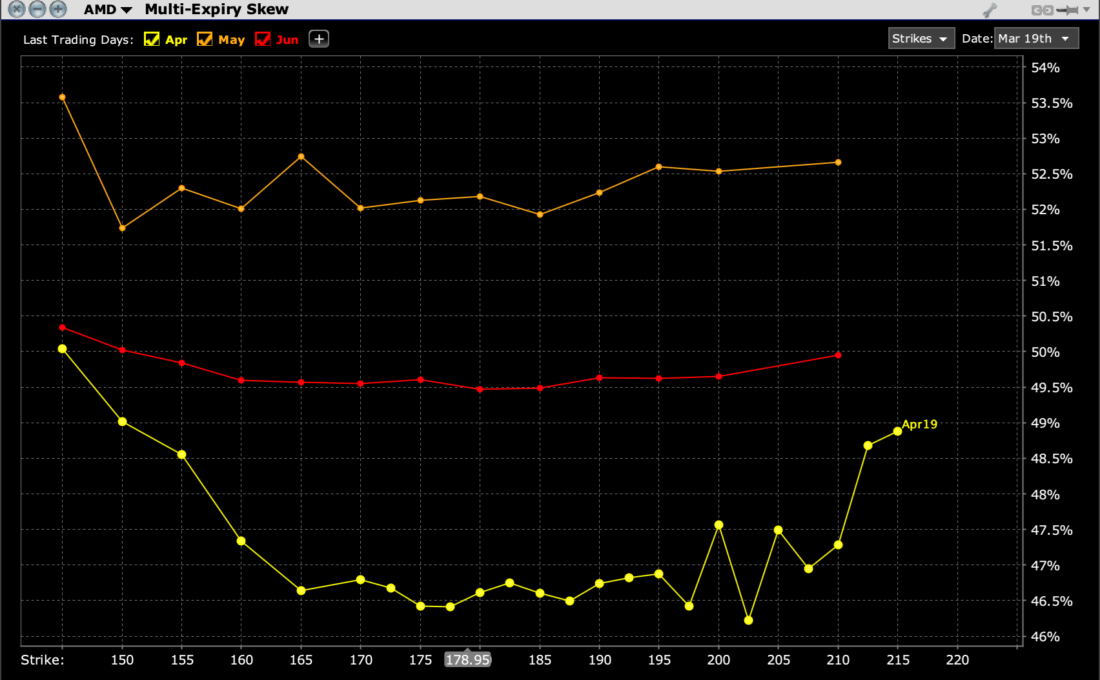
The skews for May and June NVDA options are essentially the inverse of those of SPX, while the April skew is almost linear. April AMD options are flat through most near-money strikes and flat for outer months. Let’s consider why. (Note that for both stocks, the highest overall volatilities are for options that cover each stock’s next earnings date. AMD earnings are expected after April expiration; NVDA after May’s.)
Remember, options pricing models utilize a series of well-known inputs, which include things like strike, expiration, underlying price, dividends, interest rates, and the like. The key variable input is implied volatility. We know the historical volatility of a given stock, but we’ve all heard ad infinitum that past performance is no guarantee of future results. Implied volatility reflects the market’s best estimate of what might occur during the remaining life of the option, and those estimates are heavily influenced by supply and demand.[ii]
The customary skew curve shown above for SPX reflects typical views of risk vis-à-vis supply and demand. The simplified explanation follows. The relatively depressed upside skew reflects the natural supply of options from covered call writers, while the inflated downside skew reflects a continual demand for hedging. Remember, covered call writing is a far more popular strategy than cash-secured or naked put selling, so the sellers of “insurance” need to be incentivized to offer it.
Instead, what we see in NVDA is the opposite set of motivations. We have used the term “weaponized FOMO” to refer to the rabid demand for the best-performing AI-related stocks, with NVDA being that sector’s leader. The stock’s steady ascent has radically changed the supply/demand balance. NVDA’s spectacular rise has brought out waves of speculative call buyers, while traders have less incentive to write calls on a stock that is rapidly rising. They don’t want to risk having their shares called away. In fact, we have seen many covered call writers flip to become buyers — they decided to buy back their short call positions rather than incur the short-term tax liabilities that would result from having their shares called away.
Another source of demand for upside calls is from institutional buyers. While it could easily be written off as mere speculation, I will assert that their call purchases are hedging a specific risk. Remember, FOMO is a very real concern for institutional investors. As we explained in November:
While individuals are often perceived as being more susceptible to FOMO, it actually hits professionals more directly. No portfolio manager wants to underperform his benchmark and peers, so they need to be afraid of missing out.
An investor might not want to purchase a hot stock at or near all-time highs but might also be unwilling to miss out if the rally continues. Call options allow FOMO-fearful investors to participate in a stock’s upside while limiting their downside risk to the initial premium outlay.In other words, upside calls allow the portfolio manager to purchase “FOMO insurance.”There are topsy-turvy corners of the equity markets right now – this was the explanation for one of them.
[i] For those seeking a deeper understanding of skew, check out this IBKR Campus webinar: Understanding Option Skew | IBKR Webinars | IBKR Campus
[ii] More about these concepts here: Making Sense of the Three Types of Volatility | Traders’ Insight (ibkrcampus.com)
More By This Author:
Triple Witch And SMCI Converge TodayPPI Double Beat Brings Back Memories Of Volcker, Jackson Hole
Forget CPI, Talk To Me About AI

Comments
Log in or sign up to join the conversation.