
/Amazon%20-%20Image%20by%20bluestork%20via%20Shutterstock.jpg)
bluestork via Shutterstock
Amazon.com, Inc. (AMZN) reported higher-than-expected Q2 revenue after hours on July 31. However, its insatiable capex spending lowered free cash flow (FCF) and FCF margins. Could AMZN stock be overvalued if this disappointing performance keeps up? It looks so, and this article will show why.
AMZN stock closed at $234.11 on July 31, but it's significantly lower in after-market trading. The market may be realizing that Amazon might not generate strong FCF for a while, as its AI-related spending continues to surge.
(Click on image to enlarge)
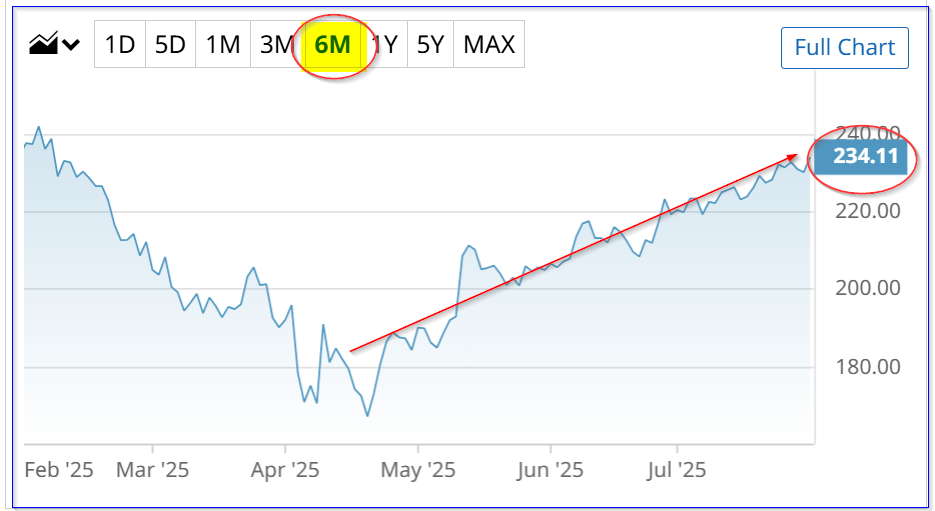
AMZN - Barchart - July 31, 2025
Moreover, based on our updated assessment of Amazon's FCF margins, AMZN stock looks overvalued here. This article will show why.
Amazon Posts Higher Revenue and Op Cash Flow
Amazon.com said revenue rose 13% YoY in Q2 to $167.7 billion, which was +3.45% higher than analysts' estimates of $162.11 billion according to Seeking Alpha.
Moreover, for the trailing 12 months (TTM) to June 30, revenue was up +10.87% from $604.3 billion last year to $670 billion this year, based on Amazon's supplemental data. Last quarter, TTM sales were just $650.3 billion, so revenue is up just +3.18% on a TTM basis.
Amazon's operating cash flow (OCF) stayed strong as it grew +12.1% to $121.1 billion on a TTM basis. (Amazon likes to view cash flow measures over a trailing 12-month period).
That represented a higher OCF margin (i.e., 18.0% of TTM revenue vs. 17.86% a year ago). Sequentially, this was also higher, as its Q1 TTM margin was just 17.5%.
Capex Spending Pushed Amazon's FCF and FCF Margins Lower
But that is where the positive numbers stopped. Due to huge capital expenditures ("capex"), its FCF and FCF margins fell both YoY and sequentially.
For example, capex spending (incl. net asset sales) in Q2 (on a TTM basis) was $102.95 billion, compared to $87.978 billion last quarter, and $54.979 billion a year ago.
That means that capex as a percent of sales rose from 9% to 13.5% in Q1 and now 15.4% (i.e., $102.95b/$670b sales) in Q2.
As a result, free cash flow, which is equal to operating cash flow (OCF) less capex, fell dramatically (again over the trailing 12-month TTM period):
$121.1 b OCF - $102.95 b capex = $18.2 billion TTM FCF
That was lower than the $25.9 billion in Q1 and $52.73 billion last year. Moreover, its FCF margin fell to just 2.7% of sales:
$18.2b TTM FCF / $670.0 b TTM revenue = 0.2716 = 2.72% FCF margin
That was significantly lower than the 4.0% FCF margin in Q1 and the 8.73% FCF margin a year ago.
Moreover, these margins are likely to stay very low going forward. For example, FCF was only slightly positive in Q2 (i.e., $1.147 billion according to data from Stock Analysis, and -$7.24 billion in Q1).
This is due to the huge amount of capex spending on AI projects, including software, Alexa, servers, and data farms, which the company appears to be increasing.
That could significantly lower the value of AMZN at least temporarily.
Forecasting AMZN Free Cash Flow
Analysts are projecting higher sales for 2025 and 2026, compared to earlier forecasts in my July 3, 2025, Barchart article on AMZN stock.
For example, the range is now between $696.44 billion for 2025 and $764.97 billion (2026), for a $730.7 billion revenue estimate for the next 12 months (NTM). That compares to $729.3 billion in my earlier article.
But in that article, we assumed FCF would come in at 5.0% of sales. That's too high now.
For example, if Amazon's OCF margin remains at 18.0% (as in Q2 on a TTM basis), and capex stays flat at $103 billion over the NTM period, FCF could rise to:
$730.7 billion NTM sales est. x 18.0% OCF margin = $131.5 billion OCF
$131.5 billion OCF - $103 billion capex = $28.5 billion FCF
FCF margin = $28.5b FCF / $730.7 b NTM sales = 0.039 = 3.9% FCF NTM margin
In other words, the FCF margin will fall from 5.0% in our prior model to just 3.9% over the next 12 months.
However, it could be lower if Amazon pushes its capex spending higher as a percent of revenue. For example, if Amazon spends 15.4% of sales on capex as in Q2, its FCF margin would fall to just 2.59%:
$730.7b NTM sales x 15.4% capex spend = $112.53 billion NTM capex (up +9.25% from $103 billion in the TTM period in Q2)
Therefore, FCF would only rise to $19 billion, or just 2.59% of sales:
$131.5 billion NTM OCF - $112.53 b capex at 15.4% of sales = $18.97 FCF NTM
$19b FCF / $730.7 b NTM sales est = 0.0259 = 2.59% FCF margin
In other words, compared to this quarter's 2.72% TTM FCF margin, over the next 12 months (NTM) FCF could fall to just 2.59% of sales.
That might now impress markets, and its valuation could stay flat. Here's why.
Setting a New AMZN Price Target
For example, let's assume Amazon.com were to pay out 100% of its future free cash flow as a dividend. What would the dividend yield be?
One clue is its existing FCF yield. For example, based on today's market cap of $2.485 trillion, according to Yahoo! Finance, AMZN has a 0.73% FCF yield today:
$18.2b TTM FCF / $2,485 billion mkt cap today = 0.0073 = 0.73% FCF yield
So, using our $19 billion FCF estimate for the next 12 months, and also a slightly better 0.7% FCF yield metric, AMZN stock could be worth more:
$19b NTM FCF / 0.007 = $2,714 billion mkt cap
That is 9.2% higher than today's mkt cap, implying that AMZN stock could be worth $255.65 per share. However, in my last Barchart article, I used a 1.11% FCF yield. Just to be generous, let's assume the market gives Amazon a 1.0% FCF yield (i.e., 100 x FCF multiple:
$19b x 100 = $1,900 billion mkt cap, or $585 billion lower than today's mkt value of $2,485 billion (i.e., -23.54%).
That means AMZN would be worth -23.54% less than today, or $179 per share:
(1-0.2354) x $234.11 = 0.7646 x $234.11 = $179.00 target price
Conclusion - Watch Out Below
As a result, based on Amazon's huge capex spending program, FCF is likely to stay very low. Moreover, its FCF margin could disappoint investors despite higher sales over the next year. As a result, the stock's valuation multiple could falter.
Therefore, the AMZN target price range over the next 12 months is between $179.00 and $255.65, or $217.33 on average. That is at least 7.2% lower than today's price.
The bottom line is that AMZN stock looks overvalued here. Watch out below, investors.
More By This Author:
META Stock Soars And Options Volume Explodes - Is META Fully Valued?
Morgan Stanley Shows Huge, Unusual Call Options Volume - Are Investors Bullish?
Pfizer Stock Is A Value Play Ahead Of Earnings - Investors Can Short PFE Puts For Income

Comments
Log in or sign up to join the conversation.