
This morning's employment report for October showed a 261K increase in total nonfarm payrolls, which was above the Investing.com forecast of 200K jobs added. The unemployment rate rose to 3.7%.
Here is an excerpt from the Employment Situation Summary released this morning by the Bureau of Labor Statistics:
Total nonfarm payroll employment increased by 261,000 in October, and the unemployment rate rose to 3.7 percent, the U.S. Bureau of Labor Statistics reported today. Notable job gains occurred in health care, professional and technical services, and manufacturing.
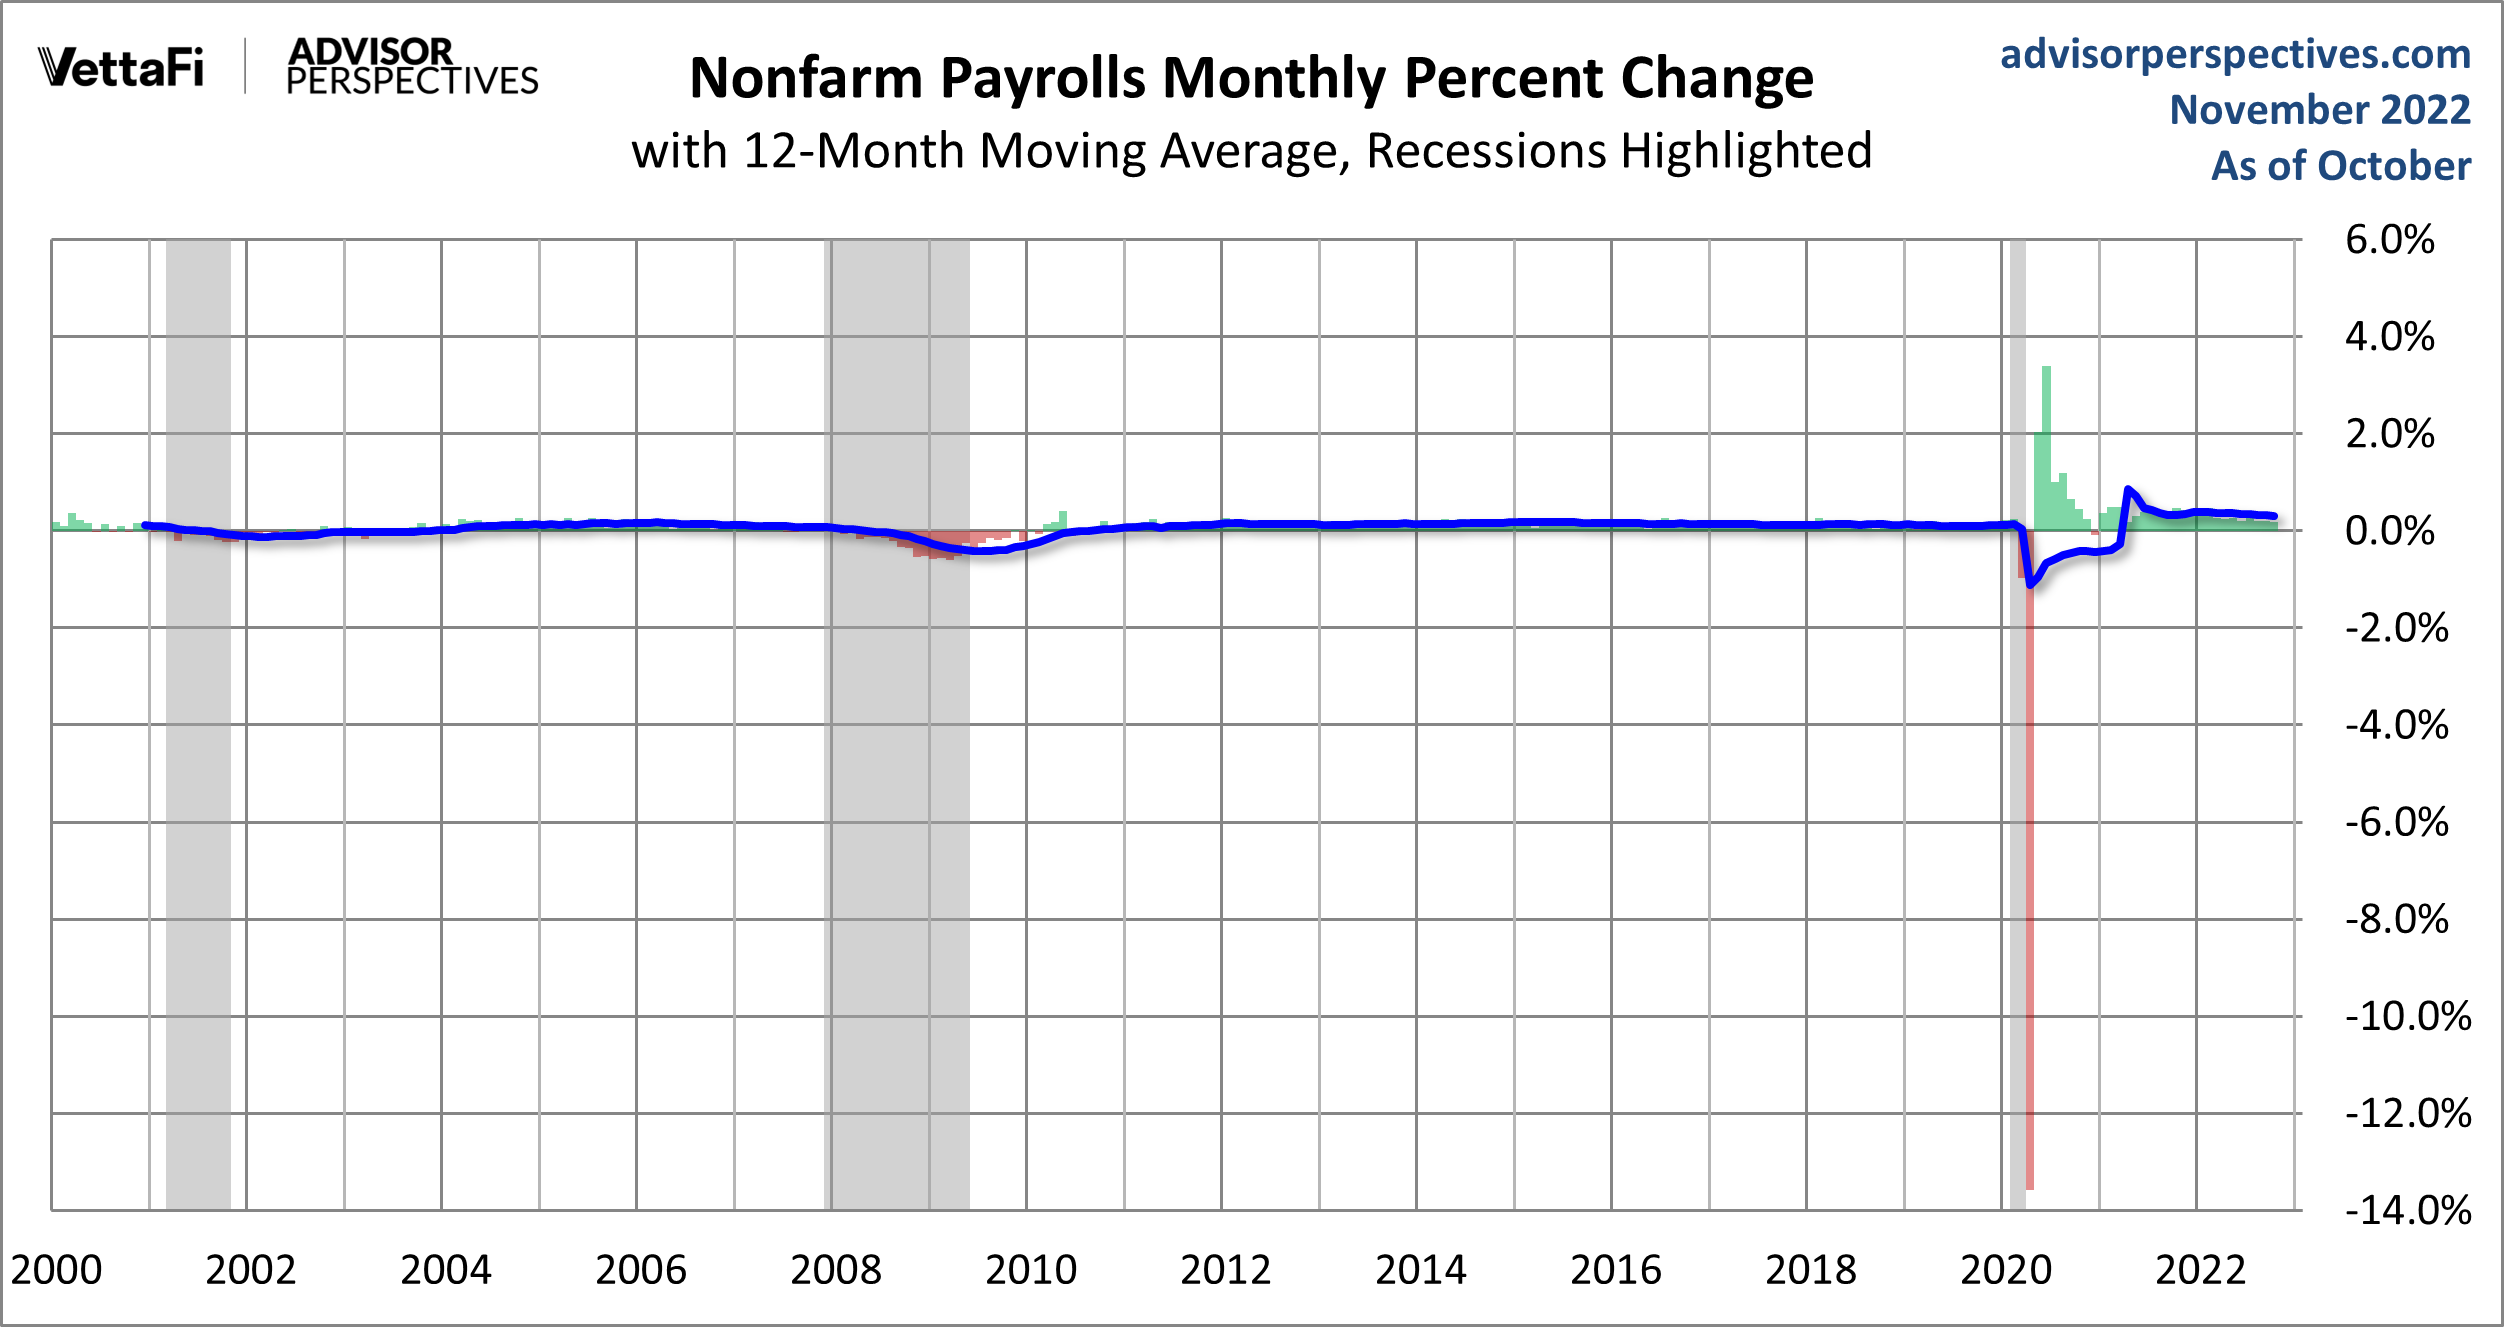
Here is a snapshot of the monthly percent change in Nonfarm Employment since 2000. We've added a 12-month moving average to highlight the long-term trend.
(Click on image to enlarge)
The chart here shows the pattern of unemployment, recessions and the S&P Composite since 1948. Unemployment is usually a lagging indicator that moves inversely with equity prices (top series in the chart). Note the increasing peaks in unemployment in 1971, 1975 and 1982. The mirror relationship appears to repeat itself with the previous bear markets. The COVID-19 pandemic briefly showed the same type of relationship between equities and unemployment, though the impact was temporary and irrational exuberance took over once again.
(Click on image to enlarge)

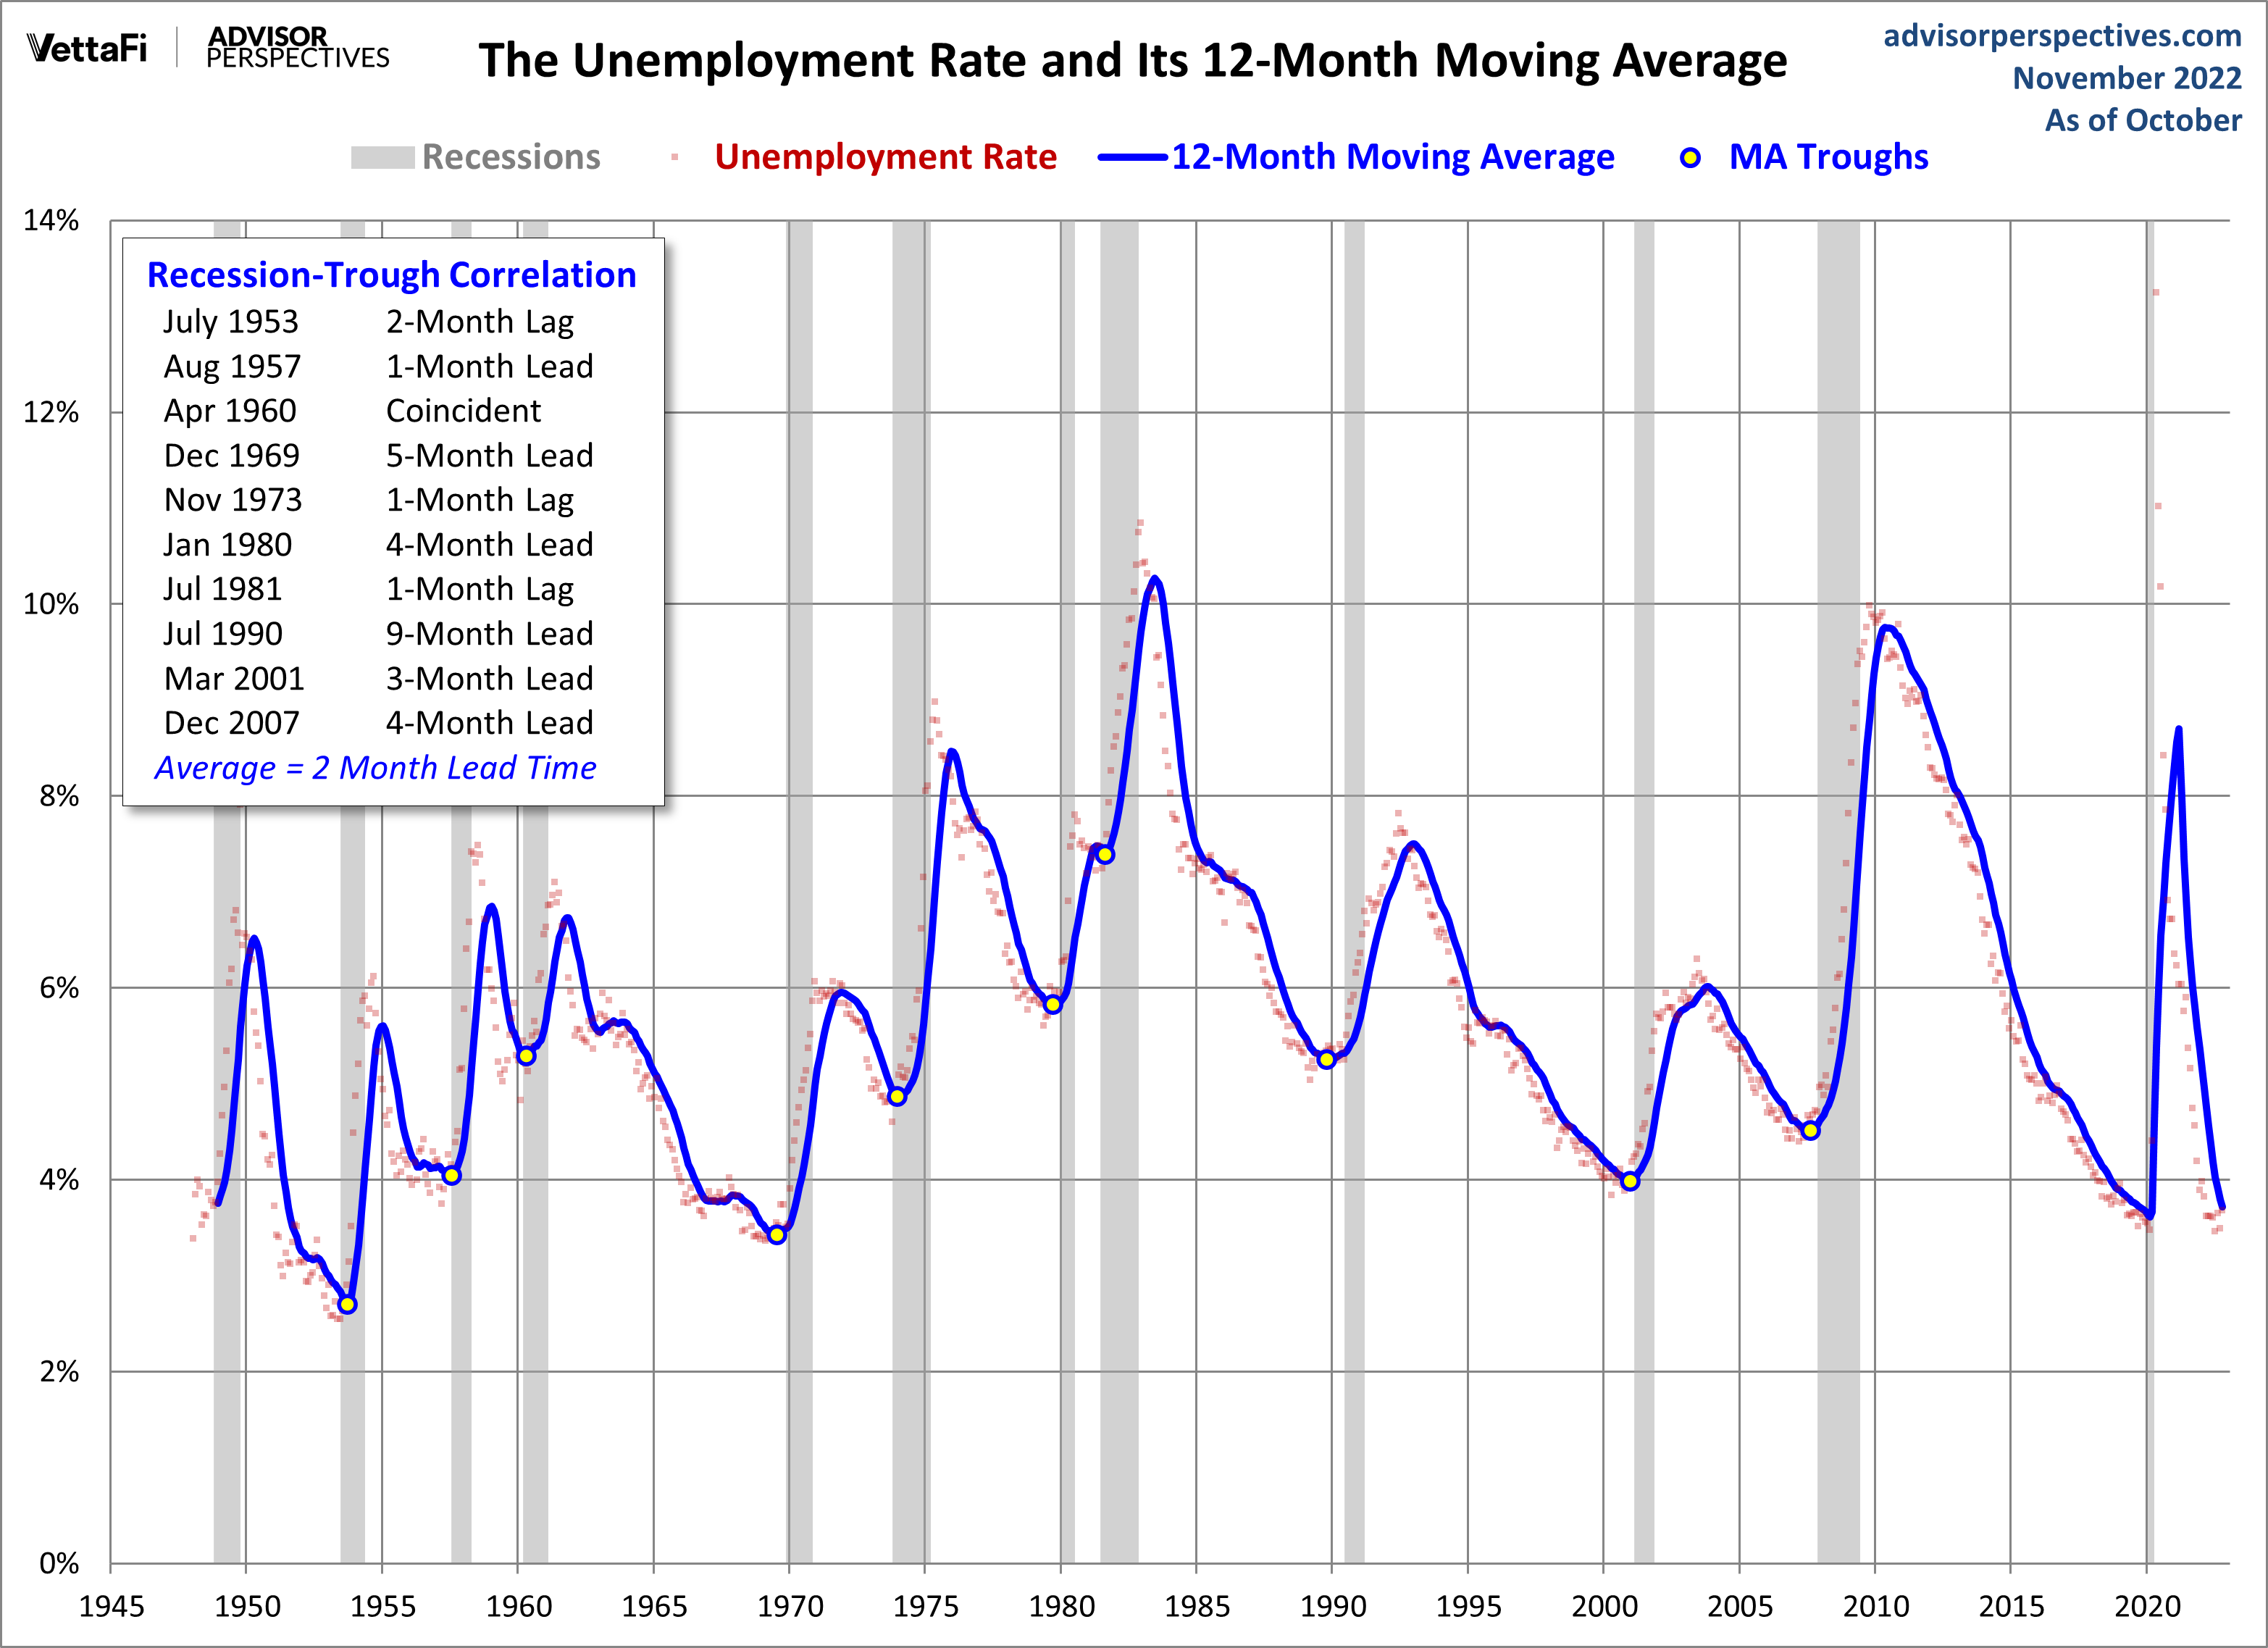
Now let's take a look at the unemployment rate as a recession indicator or more specifically the cyclical troughs in the UR as a recession indicator. The next chart features a 12-month moving average of the UR with the troughs highlighted. As the inset table shows, the correlation between the MA troughs and recession starts is remarkably close.
(Click on image to enlarge)
Here's another chart to illustrate the reality of the unemployment rate - the unemployment rate divided by the labor force participation rate.
(Click on image to enlarge)

The next chart shows the unemployment rate for the civilian population unemployed 27 weeks and over. This rate has fallen significantly since its 4.4% all-time peak in April 2010. It is now at 0.7%, up from the previous month.
(Click on image to enlarge)

More By This Author:
P/E10: October 2022 UpdateRegression To Trend: 106% Above Trend In October
S&P Global Services PMI: Contraction In October


Comments
Log in or sign up to join the conversation.