November Markit Services PMI: Strong Business Growth
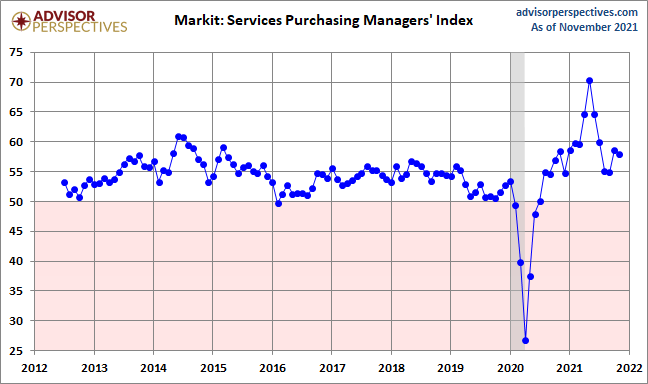
The November US Services Purchasing Managers' Index conducted by Markit came in at 58.0%, down from the final October estimate of 58.7%.
Here is the opening from the latest press release:
Commenting on the latest survey results, Chris Williamson, Chief Business Economist at IHS Markit, said:
“US business activity continued to grow at a solid rate in November, adding to signs that the pace of economic growth is accelerating in the fourth quarter after the Delta-wave induced slowdown of the third quarter. While growth is not matching the surge seen earlier in the year when the economy reopened, the fourth quarter expansion should be well above the economy’s long-run trend to mark a solid end to the year.
“Growth is lopsided, however, being led by the service sector as manufacturing remains heavily constricted by supply shortages and, in some cases, labor supply issues. These constraints are also increasingly affecting service providers, as evidenced by the service sector reporting a near record build-up of uncompleted orders during November as companies often lacked the capacity to meet demand. Cost pressures in the service sector also spiked higher in November, generally linked to higher prices paid for inputs and staff due to shortages, the rate of inflation running just shy of May’s all-time peak.
“While business expectations for the year ahead rose in November, the vast majority of the survey data were collected prior to the news of the Omicron variant, which casts a renewed shadow of uncertainty over the outlook for business and poses a downside risk to near-term growth prospects.“ [Press Release]
Here is a snapshot of the series since mid-2012.
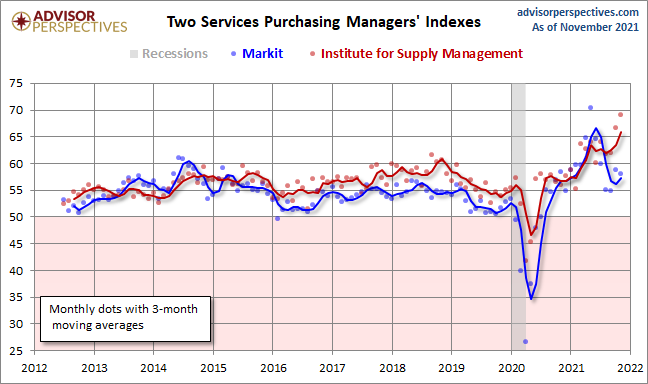
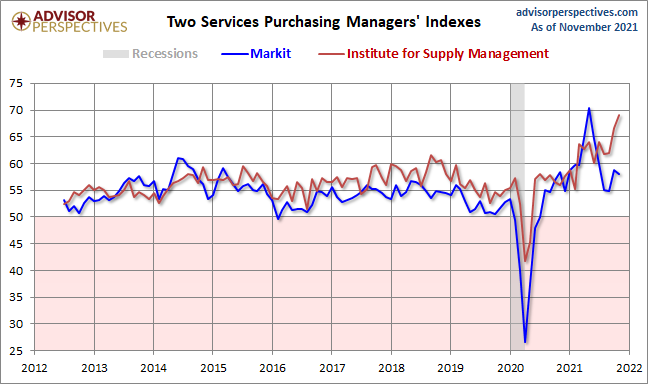
Here is an overlay with the equivalent PMI survey conducted by the Institute for Supply Management, which they refer to as "Non-Manufacturing" (see our full article on this series here). Over its history, the ISM metric has been significantly the more volatile of the two.
The next chart uses a three-month moving average of the two rather volatile series to facilitate our understanding of the current trend. Since early in 2016, the ISM metric has shown stronger growth than the Markit counterpart.