What Does All This Volatility Mean?
In addressing the question, what does all this volatility mean, academic research has a lot to offer. First a little history. In the late 1960s, the Center for Research in Securities Prices, CRSP, began making its database on stock prices and returns available to scholars throughout the country. For the first time, there was a machine ready source of carefully scrubbed data on stock returns. Scholars jumped at the opportunity and among the first studies that used the new data were those on volatility. That work continued in the following decades and led to a number of important conclusions.
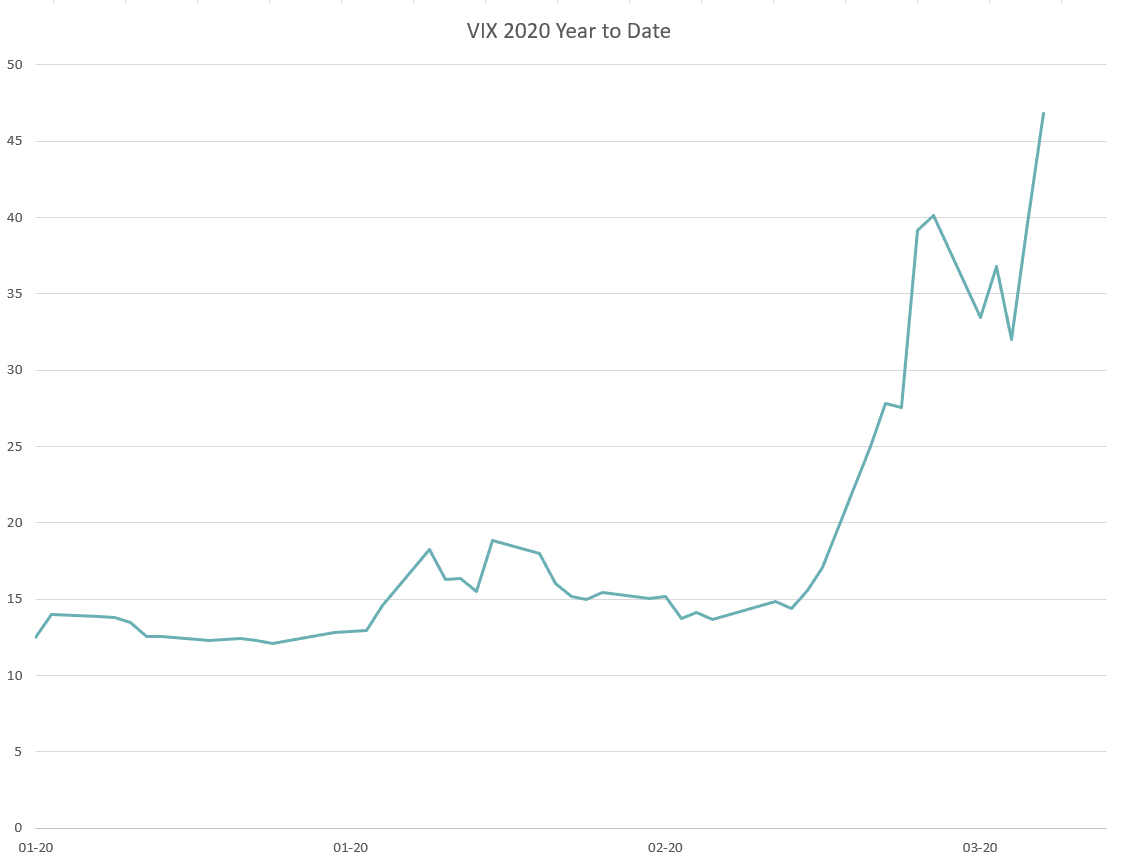
Before turning to the research results, let’s take a look at how much volatility has risen in the last few weeks. The common way of measuring the market’s assessment of volatility is to use the VIX index. The VIX index is calculated by solving for the estimate of volatility impounded in options on the S&P 500 index. The graph below shows the behavior of the VIX since the start of year. As the graph shows, the index has more than tripled. This follows more than a year during which the index was largely unchanged.
Turning to the research, there are three major groups of results. I discuss each in turn.

Volatility does not predict future price movements
This prediction is intuitive. Because historical volatility is easy to measure, if volatility predicted future price movements it would be easy to construct a strategy to beat the market. It is perhaps no surprise then that studies routinely found that volatility was not predictive. This is a warning to those who see the big up and down days as a pattern to be exploited. You might as well be “investing” based on whether a roulette wheel will come up red or black.
Current volatility predicts future volatility
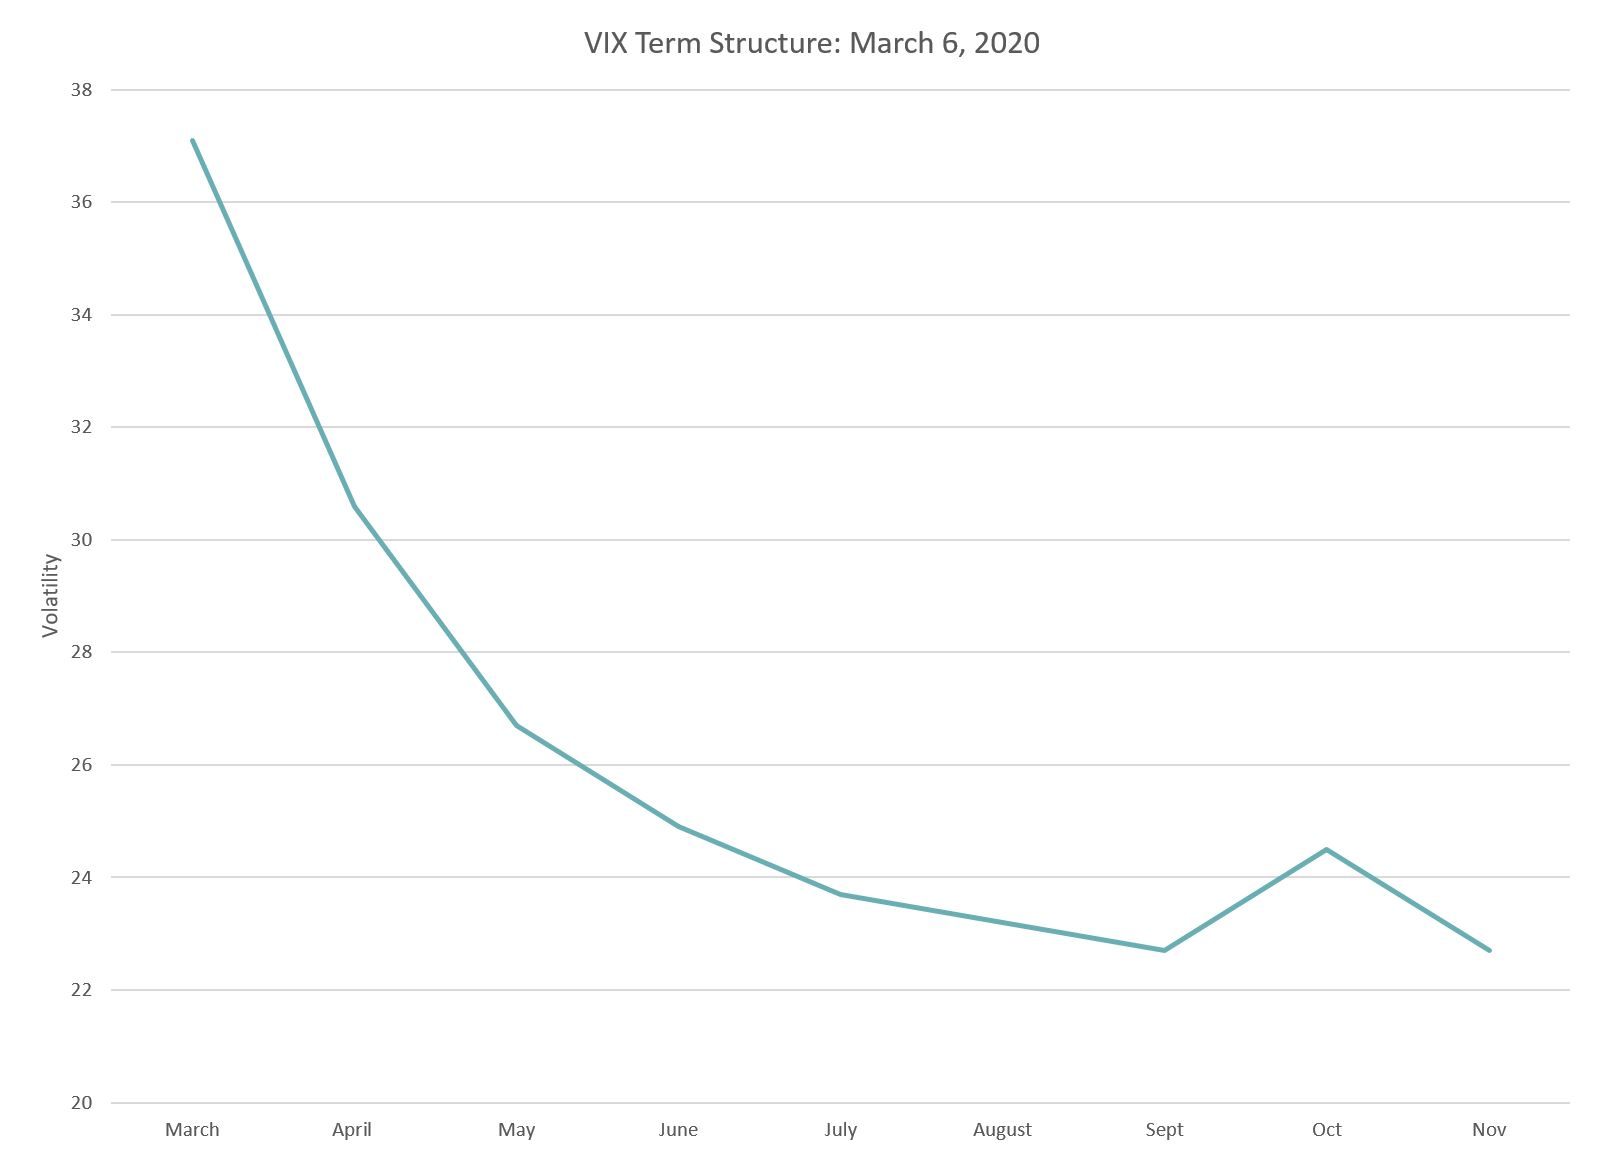
Although future price movements are not correlated with volatility, future volatility is. Periods of high volatility predict continued high volatility with a slow decay back toward the long-run average. That certainly is true of the current experience. Following the initial spike, the volatility has remained high as shown in the previous graph. Assuming the historical pattern holds, we should see continued high, but declining, volatility in the weeks ahead. Unfortunately, there is no obvious way to make money off this predictability because the market is aware of it and takes it into account when pricing securities such as options whose prices depend on volatility. The graph below plots what is called the “term structure of volatility”, where volatility is again measured by the VIX index. The graph shows the high current level of volatility declining back toward a long-run average just as the research predicts.

Volatility predicts volume
Volatility also predicts volume. When volatility rises, trading tends to rise. This indicates that there are many traders who think they can read the tea leaves in rapidly changing prices – research to the contrary. During the current upheaval volume has risen, particularly for bellwether stocks like Amazon (AMZN) and Apple (AAPL). The research clearly implies you should resist the temptation to get involved in such active trading.
What is an investor to do?
The first thing to do is to clearly separate the increase in volatility and the change in prices that has occurred simultaneously. In the current case, volatility has risen, and prices have dropped, but that should not be interpreted as implying that the increase in volatility caused the price drop.
To the extent that there is causality involved, the research implies that it goes the other way – price drops can cause the volatility to rise. Given that observation and given that volatility is not predictive of future prices changes, investors should focus on the level of prices when making investment decisions.
Future price movements and great investors
This is true at all points in time, but it adds an element of investment rationality in times of stress. The key question investors must ask is whether they believe the drop in the market has pushed prices down below fundamental value. As an indication of whether that has occurred, I recommend keeping an eye on Warren Buffett.
In a previous article, Why is Warren Buffet Sitting on $128 Billion in Cash, I suggested that he was sitting on all that cash because stock prices were simply to high relative to fundamental values. The interesting question is whether they have dropped to the point where Mr. Buffet sees some attractive opportunities
Of course, watching Warren Buffett is not an alternative for doing your own fundamental analysis. When prices are moving rapidly, it is time to take a deep breath, go back to basic discounted cash flow analysis and not try to guess the next gyration of the market.
Disclaimer: This article is not an investment recommendation, Please see our disclaimer - Get our 10 free ...
more


You had me at Buffett!