
Apple Shares Enter Correction Territory
Apple Inc. (AAPL) is engaged in designing, manufacturing and marketing mobile communication and media devices, personal computers, and portable digital music players. The Company's products and services include iPhone, iPad, Mac, iPod, Apple TV, a portfolio of consumer and professional software applications, the iOS and Mac OS X operating systems, iCloud, and a range of accessory, service and support offerings. It sells its products worldwide through its online stores, its retail stores, its direct sales force, third-party wholesalers, and resellers. Apple Inc. is headquartered in Cupertino, California.
It is rare to talk poorly of Apple shares, in fact, most of our discussions of the company are typically of the "fanboy" variety. We know about the category-leading products--indeed, Apple invented many of the categories! We know about the massive market cap--and the stock's resultant ability to move whole indices, the design wizards led by Jony Ive, the "can do no wrong" juggernaut of Cupertino, untouched by rumours of Asian sweatshops, bad wifi antennae, bendable cases, etc.
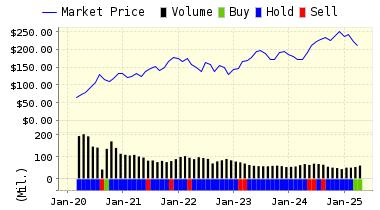
And yet here we are: over the past few weeks the stock has shed lots of value, and is now down more than 10% since it released quarterly earnings in July. It is now pretty much flat for 2015. Sales of the "killer app" for Apple, as it were, the iPhone--responsible for more than 60% of the company's revenue, have not been quite as impressive as investors have come to expect.
In addition, the jury is still out on the company's latest "must have" product-- that consumers did not even know they needed to have until Apple made it--the Apple Watch. Without mega growth in iPhones and a success with the Apple Watch, it is pretty much a given that the company will not be able to keep up its impressive record of growth and dominance.
As we have noted in the past, Apple simply cannot continue to perform as it has because it is now far too large. The numbers just don't make sense when they get so big. How much cash can they keep on hand? How much of the market can they dominate in the face of cheaper Android phones, and--GASP-- a resurgent Microsoft with its latest OS release Windows 10?
But, shares are not quite as expensive as they were the last time we saw a dip like this. They certainly have more room to fall but the company remains the one, the only, Apple after all. This may be just a temporary glitch. In the past, the stock has shed 10% or more on numerous occasions only to come roaring back stronger than ever--the last time this happened, in 2012, the shares lost almost half their value only to come back 200%.
In addition, the company retains ample cash reserves to support the stock via a buy back program if they so desire. And, that new model iPhone is coming soon. If users leapfrog the iPhone 6 models for the newest and best smart phone from Cupertino, then the stock may shake off this correction and soar yet again.
Betting against this company has been a bad move in the past, and dips were best considered to be buying opportunities. For now, our models remain enamored of the shares. ValuEngine continues its BUY recommendation on Apple Inc. for 2015-08-04. Based on the information we have gathered and our resulting research, we feel that Apple Inc. has the probability to outperform average market performance for the next year. The company exhibits attractive Company Size and Sharpe Ratio.
Below is today's more extensive data on AAPL:
|
ValuEngine Forecast |
||
|
Target |
Expected |
|
|---|---|---|
|
1-Month |
115.80 | 1.02% |
|
3-Month |
116.55 | 1.67% |
|
6-Month |
118.09 | 3.01% |
|
1-Year |
128.61 | 12.19% |
|
2-Year |
120.29 | 4.93% |
|
3-Year |
98.00 | -14.52% |
|
Valuation & Rankings |
|||
|
Valuation |
0.99% undervalued |
Valuation Rank |
|
|
1-M Forecast Return |
1.02% |
1-M Forecast Return Rank |
|
|
12-M Return |
19.93% |
Momentum Rank |
|
|
Sharpe Ratio |
0.99 |
Sharpe Ratio Rank |
|
|
5-Y Avg Annual Return |
23.88% |
5-Y Avg Annual Rtn Rank |
|
|
Volatility |
24.09% |
Volatility Rank |
|
|
Expected EPS Growth |
7.49% |
EPS Growth Rank |
|
|
Market Cap (billions) |
667.75 |
Size Rank |
|
|
Trailing P/E Ratio |
13.01 |
Trailing P/E Rank |
|
|
Forward P/E Ratio |
12.11 |
Forward P/E Ratio Rank |
|
|
PEG Ratio |
1.74 |
PEG Ratio Rank |
|
|
Price/Sales |
2.98 |
Price/Sales Rank |
|
|
Market/Book |
5.71 |
Market/Book Rank |
|
|
Beta |
0.89 |
Beta Rank |
|
|
Alpha |
0.16 |
Alpha Rank |
|
Disclosure: None.
ValuEngine subscribers can easily check out all of our top-rated STRONG BUY stocks with our "5-Engine ...
more


learn how to use instagram, how to sign up and how you can login to your instagram account ether via moble or pc if you already have one. see what each button on icon on instagram dose www.kikguru.com/instagram-app-review-instagram-login-and-sign-up/