

Image Source: Pixabay
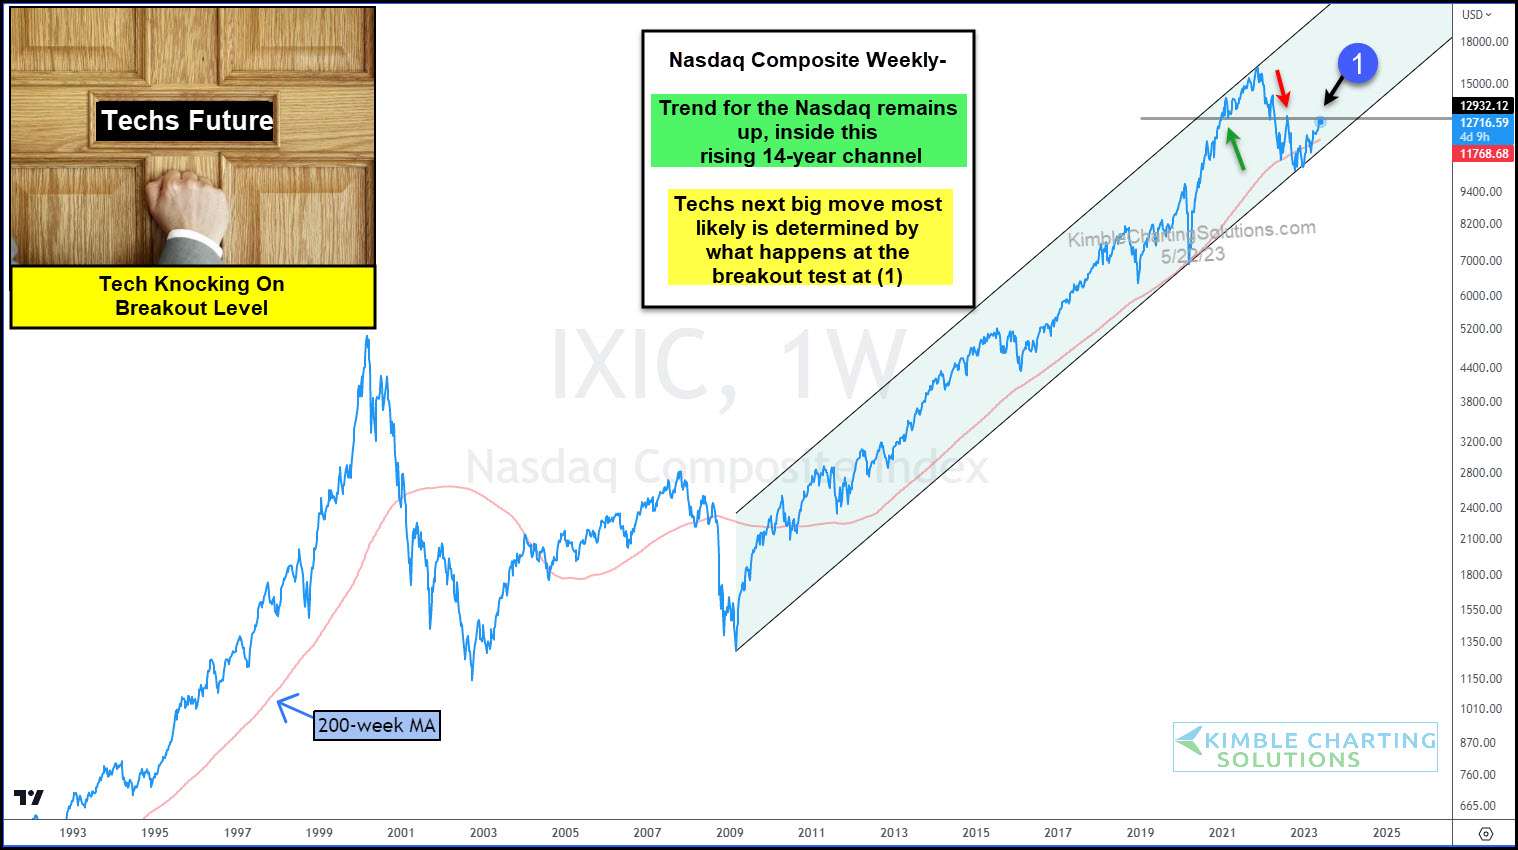
Technology stocks have continued to lead the broader market higher. Without them, who knows where the stock market would be. Today’s chart highlights Tech’s leadership, along with it’s long-term rising trend.
Below you will see a “weekly” chart of the Nasdaq Composite. As you can see, the Nasdaq is in a 14-year rising channel (bullish). And last fall’s low was formed at the lower end of the channel at the rising up-trend. We highlighted this support last month.
The Nasdaq has now rallied back to an important support/resistance area at (1). And what happens next could be a big deal. A breakout would put bulls in control, while a turn lower would give bears a chance. Stay tuned.
More By This Author:
Breakout Test In Play For TechEconomic Slowdown, Falling Interest Rates And Inflation? This Ratio Says Yes
Have Bank Stocks Bottomed? High Yields Spreads Say No


Comments
Log in or sign up to join the conversation.